. 2012 May;20(4):403-12.
doi: 10.1007/s10577-012-9284-1. Epub 2012 May 3.

Total centromere size and genome size are strongly correlated in ten grass species

Affiliations

Total centromere size and genome size are strongly correlated in ten grass species

Han Zhang et al. Chromosome Res. 2012 May.

Abstract

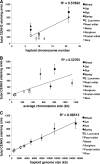
It has been known for decades that centromere size varies across species, but the factors involved in setting centromere boundaries are unknown. As a means to address this question, we estimated centromere sizes in ten species of the grass family including rice, maize, and wheat, which diverged 60~80 million years ago and vary by 40-fold in genome size. Measurements were made using a broadly reactive antibody to rice centromeric histone H3 (CENH3). In species-wide comparisons, we found a clear linear relationship between total centromere size and genome size. Species with large genomes and few chromosomes tend to have the largest centromeres (e.g., rye) while species with small genomes and many chromosomes have the smallest centromeres (e.g., rice). However, within a species, centromere size is surprisingly uniform. We present evidence from three oat-maize addition lines that support this claim, indicating that each of three maize centromeres propagated in oat are not measurably different from each other. In the context of previously published data, our results suggest that the apparent correlation between chromosome and centromere size is incidental to a larger trend that reflects genome size. Centromere size may be determined by a limiting component mechanism similar to that described for Caenorhabditis elegans centrosomes.


Figures

Fig. 1
Fig. 1
Centromere size variation in the grass species. a ClustalW2 alignment of the extreme amino-terminal sequences of CENH3 proteins in the grass species. The sequence from which the anti-OsCENH3 antibody was generated is underlined. b Immunofluorescence images showing that the kinetochores differ in size among species. Interphase cells of varied grass species were stained with anti-OsCENH3 antibodies (green) and DAPI (blue). c Total centromere areas for ten species in the grass family. Species with centromere areas that are significantly different (p < 0.01) from all others are indicated with stars. CENH3 intensity units are arbitrary and only relevant to each other
Fig. 2
Fig. 2
Relationship between total centromere area and chromosome number, chromosome size, and genome size. a Correlation between total centromere area and chromosome number. b Correlation between total centromere area and average chromosome size. c Correlation between total centromere area and genome size
Fig. 3
Fig. 3
Comparison of centromere staining areas in the oat–maize addition lines. a An immunoFISH image of an oat–maize addition line showing that maize centromeres (as identified by the green maize-specific CRM probes) are not significantly smaller than oat centromeres. The cell was stained with anti-OsCENH3 antibodies (red), CRM probes (green), and DAPI (blue). b The staining areas of maize centromeres 2 (n = 28), 6 (n = 12), and 9 (n = 27) are compared with each other and the average of the oat centromeres in the corresponding cells
Fig. 4
Fig. 4
Comparison of microtubule and kinetochore staining in three grass species. Metaphase chromosomes were stained with anti-OsCENH3 antibodies (red), an anti-tubulin antibody (green), and DAPI (blue). Note that microtubules are more abundant in species with large centromeres (wheat and barley) and less abundant in species with small centromeres (maize)
Fig. 5
Fig. 5
A limiting component model for the control of centromere size. The model shows that each species has a total centromere area that relates to genome size. A genome with few chromosomes will generally have large centromeres (left); however, if the same genome contained more chromosomes, the centromeres would be smaller (right). The total centromere area would be same in either case

Similar articles

Cited by

References

    1. Ananiev EV, Riera-Lizarazu O, Rines HW, Phillips RL. Oat–maize chromosome addition lines: a new system for mapping the maize genome. Proc Natl Acad Sci U S A. 1997;94:3524–3529. doi: 10.1073/pnas.94.8.3524. - DOI - PMC - PubMed
    1. Asai DJ, Brokaw CJ, Thompson WC, Wilson L. Two different monoclonal antibodies to alpha-tubulin inhibit the bending of reactivated sea urchin spermatozoa. Cell Motil. 1982;2:599–614. doi: 10.1002/cm.970020608. - DOI - PubMed
    1. Bartos J, Paux E, Kofler R, et al. A first survey of the rye (Secale cereale) genome composition through BAC end sequencing of the short arm of chromosome 1R. BMC Plant Biol. 2008;8:95. doi: 10.1186/1471-2229-8-95. - DOI - PMC - PubMed
    1. Bennetzen JL, Freeling M. The unified grass genome: synergy in synteny. Genome Res. 1997;7:301–306. - PubMed
    1. Black BE, Jansen LE, Maddox PS, et al. Centromere identity maintained by nucleosomes assembled with histone H3 containing the CENP-A targeting domain. Mol Cell. 2007;25:309–322. doi: 10.1016/j.molcel.2006.12.018. - DOI - PubMed

Publication types