

Neural correlates of a decision variable before learning to perform a match/non-match task
- PMID: 22553022
- PMCID: PMC3350750
- DOI: 10.1523/JNEUROSCI.6365-11.2012
Neural correlates of a decision variable before learning to perform a match/non-match task
Abstract
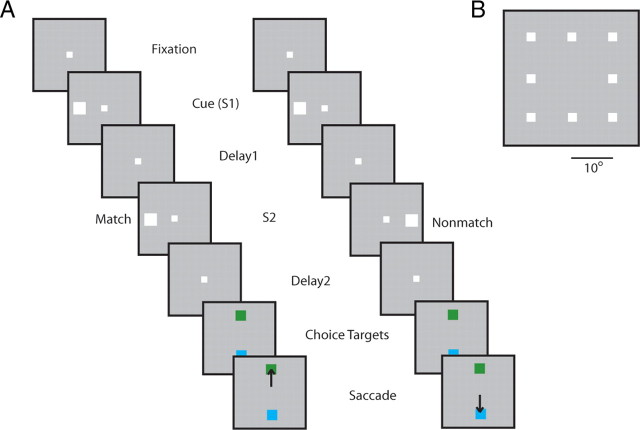
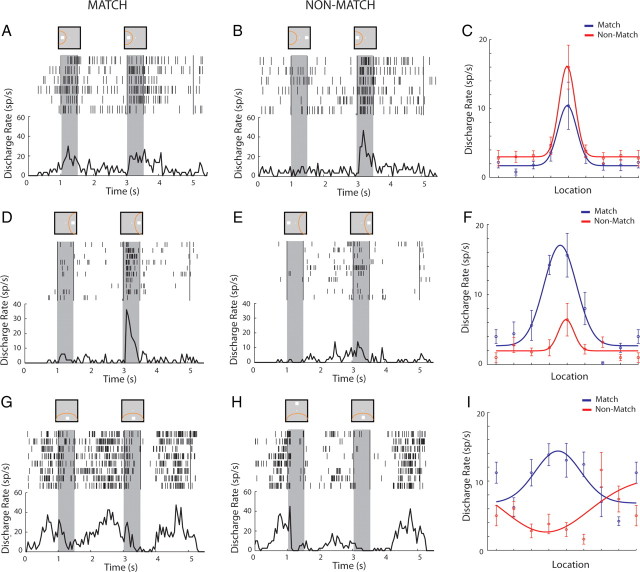
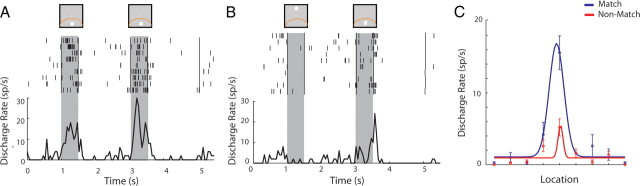
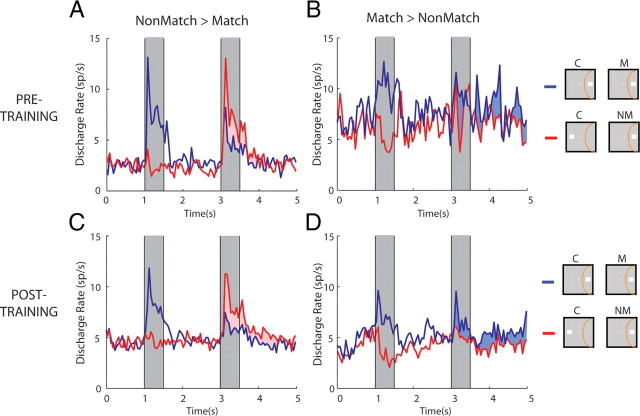
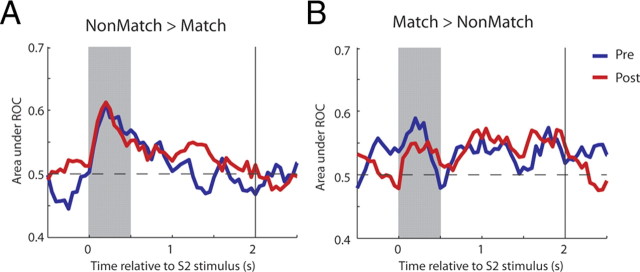
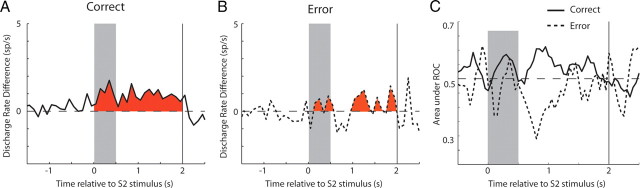
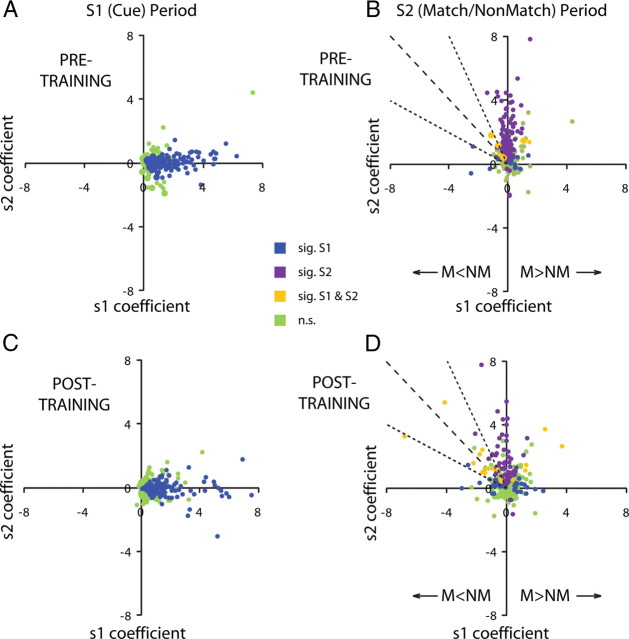
The lateral prefrontal cortex plays an important role in working memory and decision-making, although little is known about how neural correlates of these functions are shaped by learning. To understand the effect of learning on the neuronal representation of decision-making, we recorded single neurons from the lateral prefrontal cortex of monkeys before and after they were trained to judge whether two stimuli appeared at matching spatial locations. After training, and in agreement with previous studies, a population of neurons exhibited activity that was modulated depending on whether the second stimulus constituted a match or not, which had predictive ability for the monkey's choice. However, even before training, prefrontal neurons displayed modulation depending on the match or non-match status of a stimulus, with approximately equal percentages of neurons preferring a match or a non-match. The difference in firing rate and discriminability for match and non-match stimuli before training was of comparable magnitude as that after training. Changes observed after training involved an increase in the percentage of neurons exhibiting this effect, a greater proportion of neurons preferring non-match stimuli, and a greater percentage of neurons representing information about the first stimulus during the presentation of the second stimulus. Our results suggest that the neuronal activity representing some match/non-match judgments is present in the lateral prefrontal cortex even when subjects are not required to perform a comparison and before any training.
Figures
Similar articles
-
Task-specific modulation of PFC activity for matching-rule governed decision-making.Brain Struct Funct. 2021 Mar;226(2):443-455. doi: 10.1007/s00429-020-02191-7. Epub 2021 Jan 4. Brain Struct Funct. 2021. PMID: 33398431 Free PMC article.
-
Emergence of Nonlinear Mixed Selectivity in Prefrontal Cortex after Training.J Neurosci. 2021 Sep 1;41(35):7420-7434. doi: 10.1523/JNEUROSCI.2814-20.2021. Epub 2021 Jul 22. J Neurosci. 2021. PMID: 34301827 Free PMC article.
-
Changes in prefrontal neuronal activity after learning to perform a spatial working memory task.Cereb Cortex. 2011 Dec;21(12):2722-32. doi: 10.1093/cercor/bhr058. Epub 2011 Apr 28. Cereb Cortex. 2011. PMID: 21527786 Free PMC article.
-
[Neural mechanisms of decision making].Brain Nerve. 2008 Sep;60(9):1017-27. Brain Nerve. 2008. PMID: 18807936 Review. Japanese.
-
Valuation of uncertain and delayed rewards in primate prefrontal cortex.Neural Netw. 2009 Apr;22(3):294-304. doi: 10.1016/j.neunet.2009.03.010. Epub 2009 Mar 29. Neural Netw. 2009. PMID: 19375276 Free PMC article. Review.
Cited by
-
Prefrontal cortical plasticity during learning of cognitive tasks.Nat Commun. 2022 Jan 10;13(1):90. doi: 10.1038/s41467-021-27695-6. Nat Commun. 2022. PMID: 35013248 Free PMC article.
-
Unique and shared roles of the posterior parietal and dorsolateral prefrontal cortex in cognitive functions.Front Integr Neurosci. 2012 May 3;6:17. doi: 10.3389/fnint.2012.00017. eCollection 2012. Front Integr Neurosci. 2012. PMID: 22563310 Free PMC article.
-
The neuroscience of working memory capacity and training.Nat Rev Neurosci. 2016 Jul;17(7):438-49. doi: 10.1038/nrn.2016.43. Epub 2016 May 26. Nat Rev Neurosci. 2016. PMID: 27225070 Review.
-
Task-specific modulation of PFC activity for matching-rule governed decision-making.Brain Struct Funct. 2021 Mar;226(2):443-455. doi: 10.1007/s00429-020-02191-7. Epub 2021 Jan 4. Brain Struct Funct. 2021. PMID: 33398431 Free PMC article.
-
On the relationship between persistent delay activity, repetition enhancement and priming.Front Psychol. 2015 Jan 22;5:1590. doi: 10.3389/fpsyg.2014.01590. eCollection 2014. Front Psychol. 2015. PMID: 25657630 Free PMC article. Review.
References
-
- Asaad WF, Rainer G, Miller EK. Neural activity in the primate prefrontal cortex during associative learning. Neuron. 1998;21:1399–1407. - PubMed
-
- Barraclough DJ, Conroy ML, Lee D. Prefrontal cortex and decision making in a mixed-strategy game. Nat Neurosci. 2004;7:404–410. - PubMed
-
- Brainard DH. The psychophysics toolbox. Spat Vis. 1997;10:433–436. - PubMed
-
- Freedman DJ, Assad JA. Experience-dependent representation of visual categories in parietal cortex. Nature. 2006;443:85–88. - PubMed
Publication types
MeSH terms
Grants and funding
LinkOut - more resources
Full Text Sources