. 2012 May 2;32(18):6183-96.
doi: 10.1523/JNEUROSCI.0343-12.2012.

Neurotransmitter release at the thalamocortical synapse instructs barrel formation but not axon patterning in the somatosensory cortex

Affiliations

Neurotransmitter release at the thalamocortical synapse instructs barrel formation but not axon patterning in the somatosensory cortex

Nicolas Narboux-Nême et al. J Neurosci. .

Abstract

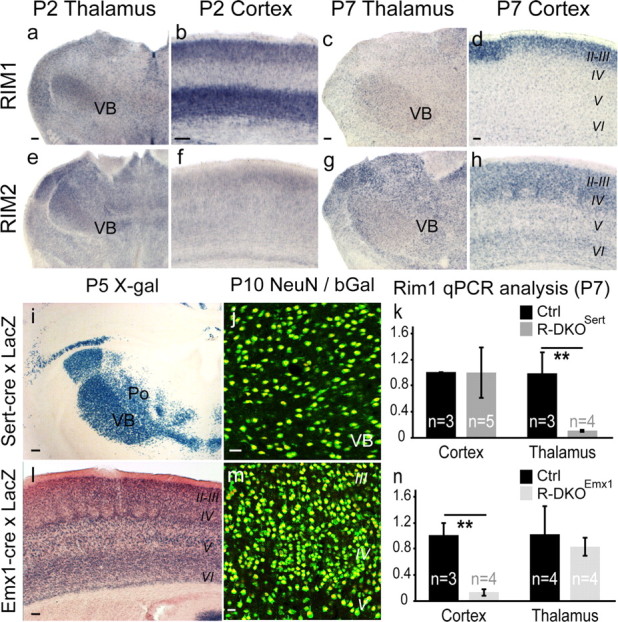
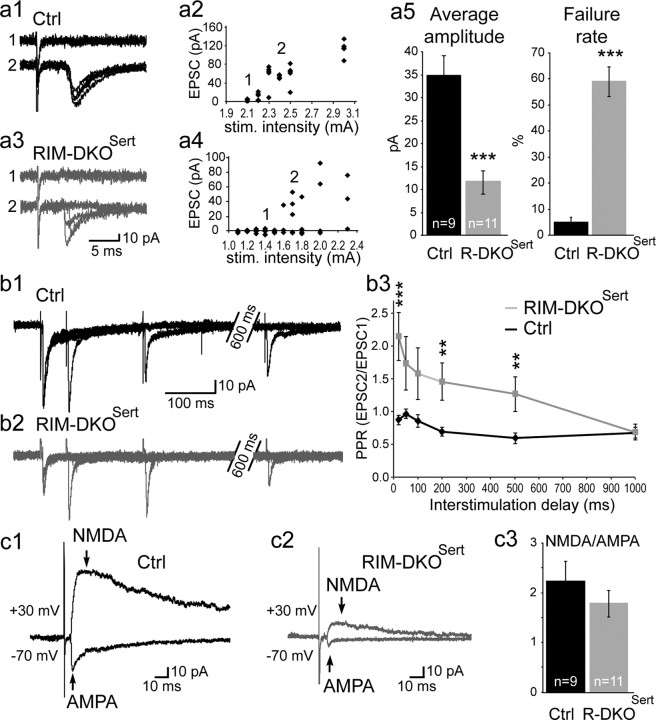
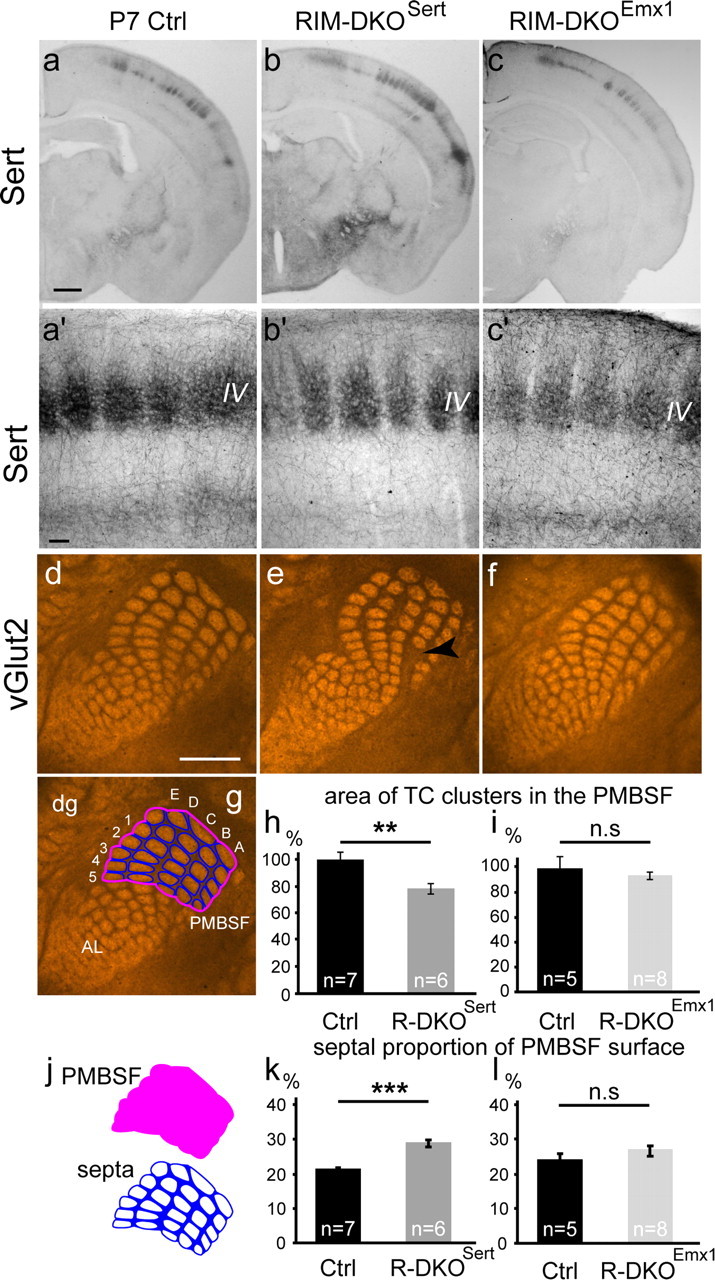
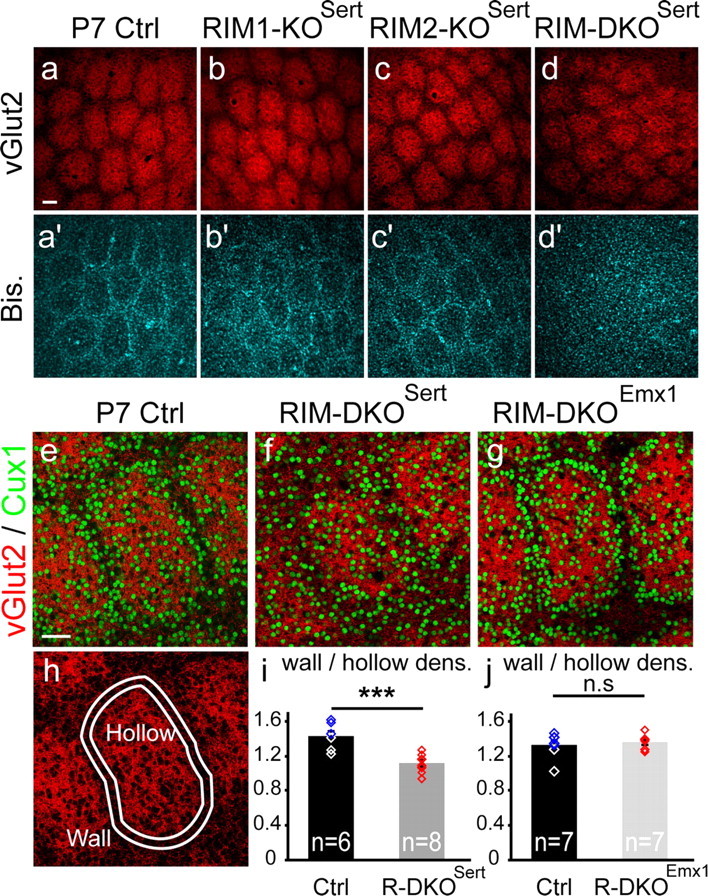
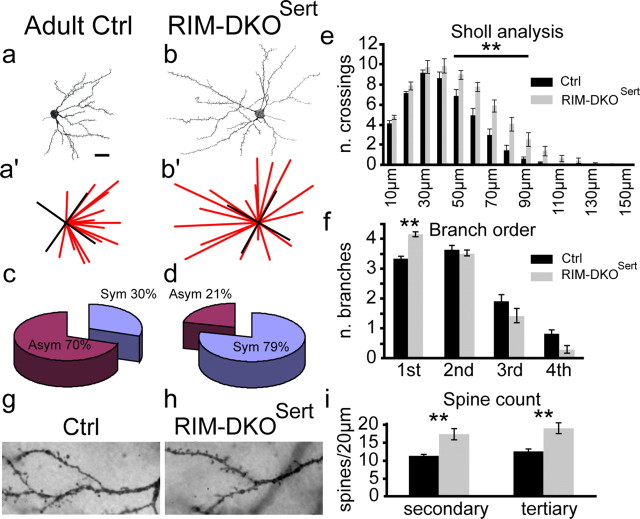
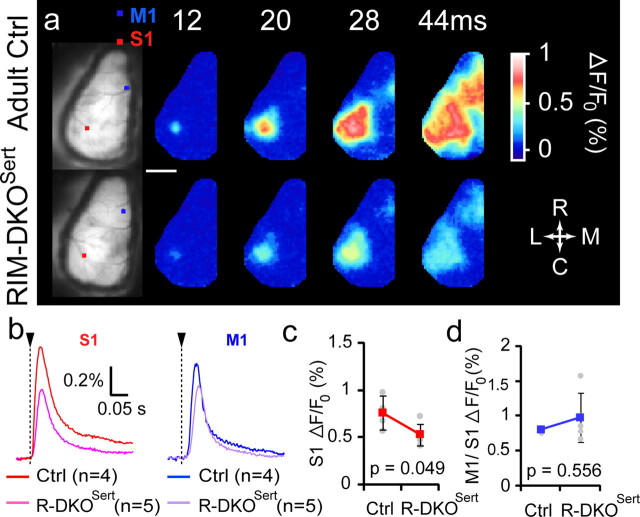
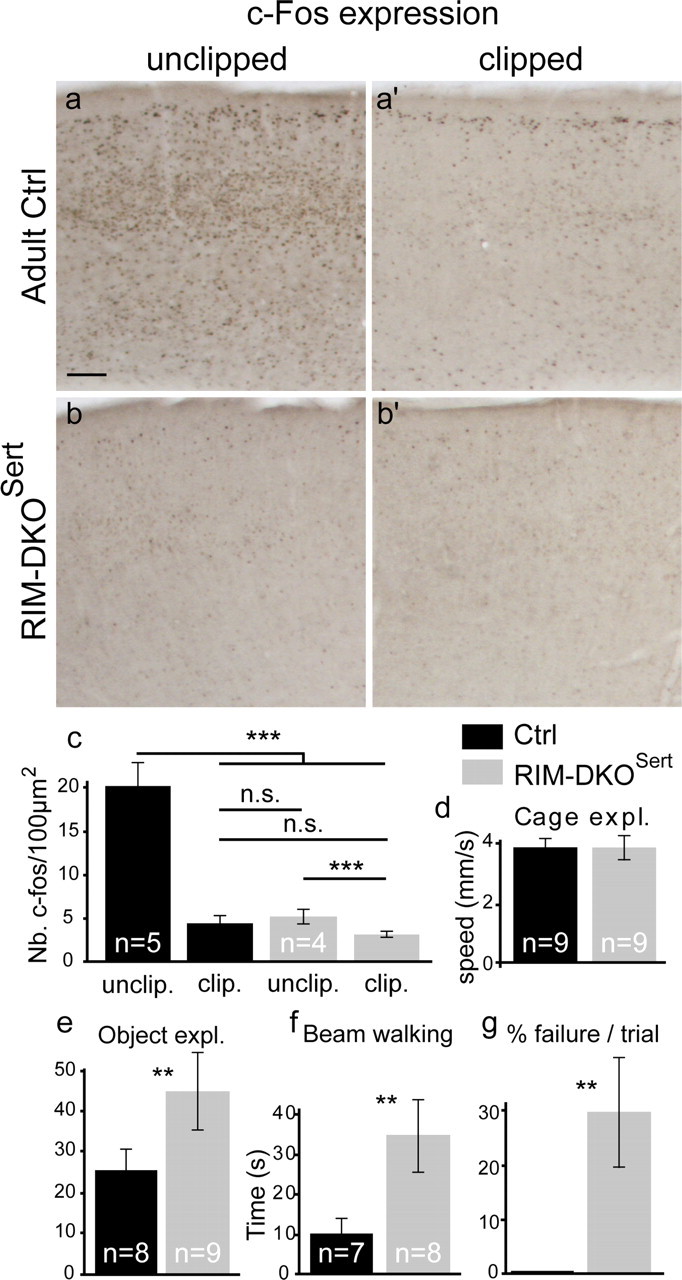
To assess the impact of synaptic neurotransmitter release on neural circuit development, we analyzed barrel cortex formation after thalamic or cortical ablation of RIM1 and RIM2 proteins, which control synaptic vesicle fusion. Thalamus-specific deletion of RIMs reduced neurotransmission efficacy by 67%. A barrelless phenotype was found with a dissociation of effects on the presynaptic and postsynaptic cellular elements of the barrel. Presynaptically, thalamocortical axons formed a normal whisker map, whereas postsynaptically the cytoarchitecture of layer IV neurons was altered as spiny stellate neurons were evenly distributed and their dendritic trees were symmetric. Strikingly, cortex-specific deletion of the RIM genes did not modify barrel development. Adult mice with thalamic-specific RIM deletion showed a lack of activity-triggered immediate early gene expression and altered sensory-related behaviors. Thus, efficient synaptic release is required at thalamocortical but not at corticocortical synapses for building the whisker to barrel map and for efficient sensory function.


Figures

Figure 1.
Figure 1.
RIM 1 and RIM2 expression and Cre-mediated recombination. ah, In situ hybridization using RIM1 and RIM2 antisense probes at P2 and P7. ad, RIM1 is expressed in the somatosensory thalamus (VB; a) and in the cortex with highest expression in deep layers at P2 (b) and upper layers at P7 (d). eh, RIM2 is broadly expressed in the thalamus including the VB (e), with a low expression in the P2 cerebral cortex (f) and higher expression at P7 (h). in, Recombination induced by Sert-cre and Emx1-cre. Cre mice were crossed with a reporter strain expressing a nuclear β-Galactosidase (Taumgfp-nls-LacZ). This recombination, visualized by X-gal staining (i, l) and β-Gal/NeuN double immunolabeling (j, m) shows extensive neuronal recombination in the VB of Sert-cre mice (i, j), and cerebral cortex of Emx1-cre mice (l, m). k, n, Thalamic and cortical mRNAs from P7 brains of both strains were extracted and measured by qPCR. Results for Rim1 are summarized in k for RIM-DKOSert and in n for RIM-DKOEmx1. **p < 0.05. Scale bars: (in ai, l, 100 μm; j, m, 25 μm.
Figure 2.
Figure 2.
Reduction of the TC synaptic transmission in the RIM-DKOSert mice. The TC synapses were analyzed in P5 to P7 brain slices preserving the TC pathway. TC axons were stimulated at low frequency (0.03 Hz) in the internal capsule and the TC EPSCs were recorded in layer IV neurons. a1, a3, Superimposed individual responses show failures (1) and single afferent fiber EPSC (2) in control (a1) and RIM-DKOSert (a3) mice. a2, a4, The peak amplitude of the AMPA component of the evoked TC EPSC is plotted against the IC stimulation intensity for the same recordings in control (a2) and RIM-DKOSert (a4) mice. This curve was plotted for every recording to find out the stimulation intensity needed to record a single afferent fiber unitary EPSC, that is 2.4 mA in control and 1.7 mA in RIM-DKOSert mice. a5, Summary data (mean ± SEM) showing a 60% reduction of the evoked TC unitary EPSC amplitude in the RIM-DKOSert (n = 11; gray) compared with control (n = 9; black) mice. The amplitude of the unitary EPSC includes the failures. The reduction of the unitary EPSC is associated with an increase of the failure rate (*** p < 0.001). b1, b2, Paired-pulse stimulation experiments at various intervals (0.05 s, 0.2 s, 1 s) showed paired pulse depression of the TC EPSCs in control (b1) and paired pulse facilitation in RIM-DKOSert (b2) mice. b3, Summary data of the paired-pulse ratio at various intervals (0.05 s, 0.1 s, 0.2 s, 0.5 s, 1 s) in control (n = 9, black curve) and RIM-DKOSert (n = 11, gray curve) mice. c1, c2, The amplitude of the AMPA and NMDA components of the TC EPSC were obtained by recording EPSC at −70 mV and +30 mV in control (c1) and RIM-DKOSert (c2) mice. c3, This NMDA/AMPA ratio was found similar in control (2.22 ± 0.37, n = 9) and RIM-DKOSert (1.77 ± 0.27, n = 11) mice.
Figure 3.
Figure 3.
Laminar and tangential distribution of TC axons in S1 of RIM-DKOSert and RIM-DKOEmx1 mice. ac, To analyze the TC tracts and laminar distribution of TC axons in RIM-DKOSert and RIM-DKOEmx1 mice, SERT-immunocytochemistry was performed in coronal sections of P7 brains. In the three genotypes: control (a), RIM-DKOSert (b), and RIM-DKOEmx1 (c), thalamic axons reach the cortical layers VI and IV where they arborize into well delimited clusters (a′–c). df, To evaluate the topographic map formed by TC axons in a tangential plane, vGlut2 immunohistochemistry was performed on serial tangential sections of flattened cortical hemispheres of P7 mice. The sections through layer IV were photographed and analyzed. The TC clusters corresponding to the barrels of the principal whiskers in the PMBSF are clearly delimited in control (d) RIM-DKOSert (e) and RIM-DKOEmx1 (f) mice; Increase in the septal intervals between barrel rows in the RIM-DKOSert cortex is shown with arrowhead in e. g, j, quantification method: the PMBSF area was delimited by joining the external boundaries of the vGlut2 stained patches corresponding to the five rows of the main vibrissae (delineated in pink). The area covered by the individual TC patches/barrels was measured (white areas) and the septal area was calculated as the difference between these two areas (blue area). h, i, histograms showing the summed area of each individual patch in the PMBSF, normalized to area measured in the control, in the RIM-DKOSert (h) and the RIM-DKOEmx1 (i) mice; k, l, quantification of the septal/PMBSF area ratio in RIM-DKOSert (k) and RIM-DKOEmx1 (l) mice. AL: anterolateral barrel subfield, dg: digits; PMBSF: posteromedial barrel subfields, A–E: barrel rows, 1–5: barrel columns. Scale bars: a, 500 μm; a′, 100 μm; d, 1 mm.
Figure 4.
Figure 4.
TC synapses form normally in RIM-DKOSert. a–c, Ultrastructural analysis of the TC synapses. vGlut2 pre-embedding immunocytochemistry was performed and revealed with diaminobenzidine (a, b) or gold (c). In control (a) and RIM-DKOSert (b, c) mice, the terminal boutons are filled with synaptic vesicles and form asymmetric synapses that are frequently fenestrated (arrowheads). Scale bar: (in a) ac, 500 μm.
Figure 5.
Figure 5.
Deletion of RIM1–2 in the thalamus alters barrel development. Cortices from control, RIM1-KOSert, RIM2-KOSert, and RIM-DKOSert mice were tangentially sectioned through layer IV and labeled for vGlut2 to reveal TC terminals (ad) and DAPI to reveal the nuclei of cells in layer IV (a′d′). ad, The whisker-related patterns as revealed with vGlut2 immunocytochemistry are similar in all 4 genotypes. In the small anterior snout barrels: a′d′, DAPI staining reveals a normal barrel-like organization of layer IV cells in the control (a′), the RIM1-KOSert (b′) and the RIM2-KOSert (c′) in the RIM-DKOSert mice, however, layer IV neurons are uniformly distributed (d′). Scale bar: 50 μm. (e–j) Double immunolabeling of vGlut2-positive TC axons and Cux1-positive layer IV cortical neurons in P7 tangential sections through principal barrels of the PMBSF in control (e), RIM-DKOSert (f) and RIM-DKOEmx1 (g) mice. The barrel-like organization of layer IV neurons is visible with Cux1 labeling in control (f) and DKOEmx1 (g) mice. In contrast Cux1-labeled neurons are uniformly distributed in the DKOSert mice (f). h, To estimate neuronal density in the barrel septae and hollows, a mask was computed based on the intensity of vGlut2-positive staining (the barrel hollow), and another mask was drawn surrounding it as 20-μm-thick band (the barrel wall). Density of neurons was counted in these 2 areas (i, j). Histograms show the ratios of neuronal density between the walls and the hollows; and values were individually plotted (diamonds). This wall/hollow ratio is significantly reduced in RIM-DKOSert mice compared with controls (i), whereas the wall/hollow ratio is unchanged in RIM-DKOEmx1 compared with controls (j). ***p < 0.001; n.s., nonsignificant. Scale bars: a (for ad′), e (for eh), 50 μm.
Figure 6.
Figure 6.
Morphology of layer IV cortical neurons in RIM-DKOSert mice. a, b, Camera lucida drawings of Golgi-Cox-stained spiny stellate neurons in the barrel cortex. Typical layer IV neurons from control (a) and RIM-DKOSert (b) are illustrated. (a′, b′) to measure dendritic orientation, lines were drawn from the tip of each dendrite to the center of the cell soma; and the number of lines per quadrant was taken as an index of dendritic symmetry. c, d, The pie charts present the percentage of assymetric/symetric profiles for control (c) and RIM-DKOSert (d) mice. e, Sholl analysis: the histograms represent the mean number (+SEM) of dendrites crossing concentric rings drawn at 10 μm intervals from the cell soma. f, Histogram depicting the mean + SEM of first, second, third, and fourth order dendritic branches of spiny stellate neurons in control and DKOSert mice. g, h, micrographs of Golgi stained second and third order dendrites. Spines appear to be more numerous in the RIM-DKOSert neurons (h), than in controls (g). i, Histogram of the mean + SEM spine counts on 20-μm-long sections of second and third order dendrites of neurons from RIM-DKOSert and control brains. **p < 0.05. Scale bar, 20 μm.
Figure 7.
Figure 7.
Cortical sensory processing is altered in RIM-DKOSert mice. a, VSD imaging of cortical activity evoked by single whisker (C2) deflection in control and RIM-DKOSert mice. Typical responses are illustrated in the upper panel: the first images on the left show resting fluorescence of VSD-stained unilateral craniotomies. The squares indicate the regions of interest used to quantify the signal on the C2 barrel column of the primary somatosensory cortex (S1, red square) and in the primary motor cortex (M1, blue square). Adjacent images show the VSD fluorescence changes at different times following a single right C2 whisker deflection. Scale bar, 2 mm. b, Averaged responses from control mice and RIM-DKOSert mice, quantified from S1 (left) and M1 (right). c, Peak amplitudes of the sensory responses measured in S1. d, Ratio M1/S1 (means ± SD for each group).
Figure 8.
Figure 8.
Reduced activity-dependent expression of c-Fos in the somatosensory cortex and altered sensory-motor behavior. ab′, Adult mice had all whiskers clipped on one side of the snout, and were placed 1 h in an enriched environment the following day. c-Fos immunoreactivity was revealed on coronal brain sections through the primary somatosensory cortex of the unclipped (contralateral, a, b) and clipped (ipsilateral, a′, b′) sides in control (a, a′) and RIM-DKOSert mice (b, b′). c, Density estimates of c-Fos labeled neurons (mean + SEM) in layer IV from 5 control and 6 recombined mice, shows a significant increase in the S1 cortex corresponding to the unclipped whisker. In the RIM-DKOSert c-Fos expression on both sides is similar to the clipped side of the control. However c-Fos activation is detectable in the mutants when the clipped side is compared with unclipped side. d, General exploratory behavior. Mice of both genotypes did not differ in terms of general activity and exploration, as estimated by videotracking in a box during 10 min sessions. e, Exploration of novel objects. The time exploring new objects was increased in the RIM-DKOSert mice compared with controls. f, g, Beam walking test. RIM-DKOSert needed more time than controls to cross the beam successfully (f). Moreover, RIM-DKOSert mice showed a high probability of failure to cross within the 2 min trial, whereas control showed a very low incidence of failures (g). Scale bar: (in a) ab′, 125 μm. ***p < 0.001; **p < 0.05.

Similar articles

Cited by

References

    1. Ballester-Rosado CJ, Albright MJ, Wu CS, Liao CC, Zhu J, Xu J, Lee LJ, Lu HC. mGluR5 in cortical excitatory neurons exerts both cell-autonomous and -nonautonomous influences on cortical somatosensory circuit formation. J Neurosci. 2010;30:16896–16909. - PMC - PubMed
    1. Benshalom G, White EL. Quantification of thalamocortical synapses with spiny stellate neurons in layer IV of mouse somatosensory cortex. J Comp Neurol. 1986;253:303–314. - PubMed
    1. Bonnin A, Torii M, Wang L, Rakic P, Levitt P. Serotonin modulates the response of embryonic thalamocortical axons to netrin-1. Nat Neurosci. 2007;10:588–597. - PubMed
    1. Borodinsky LN, Root CM, Cronin JA, Sann SB, Gu X, Spitzer NC. Activity-dependent homeostatic specification of transmitter expression in embryonic neurons. Nature. 2004;429:523–530. - PubMed
    1. Bourgeron T. A synaptic trek to autism. Curr Opin Neurobiol. 2009;19:231–234. - PubMed

Publication types

Substances

LinkOut - more resources