. 2012 May 2;32(18):6197-208.
doi: 10.1523/JNEUROSCI.5757-11.2012.

Subunit-selective allosteric inhibition of glycine binding to NMDA receptors

Affiliations

Subunit-selective allosteric inhibition of glycine binding to NMDA receptors

Kasper B Hansen et al. J Neurosci. .

Abstract

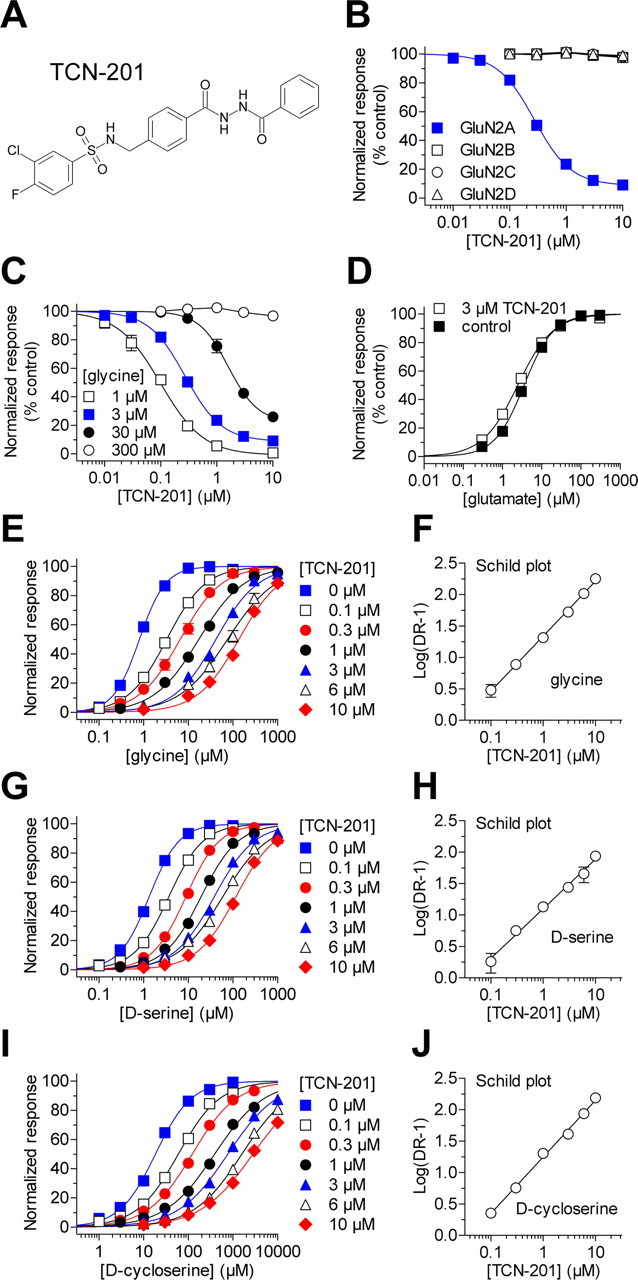
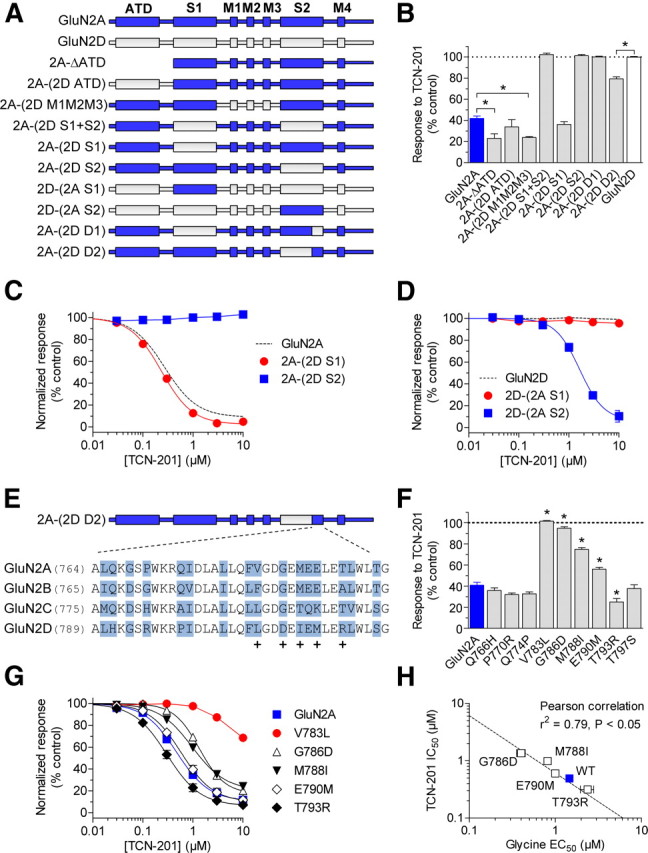
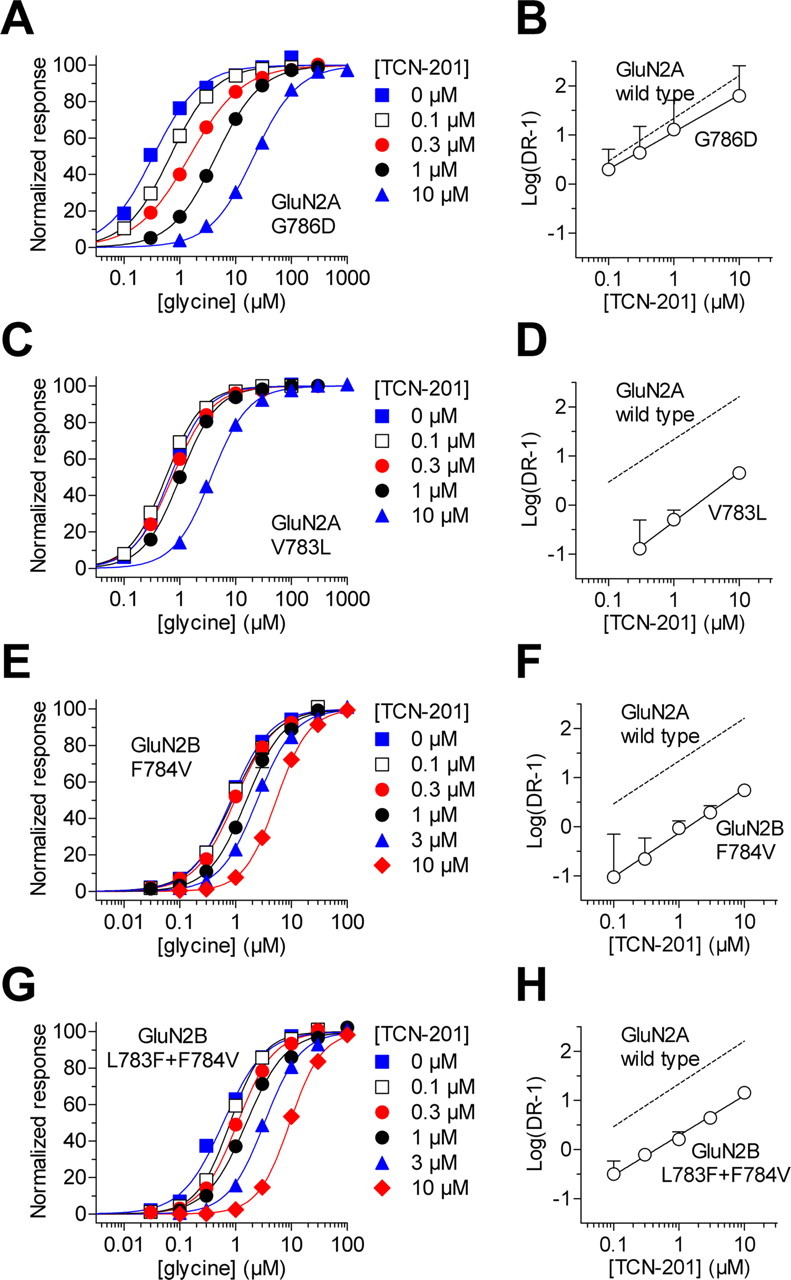
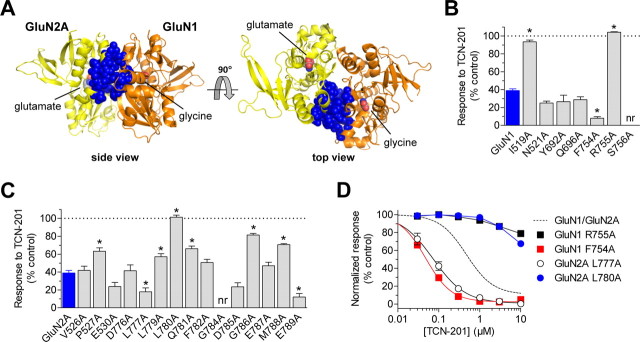
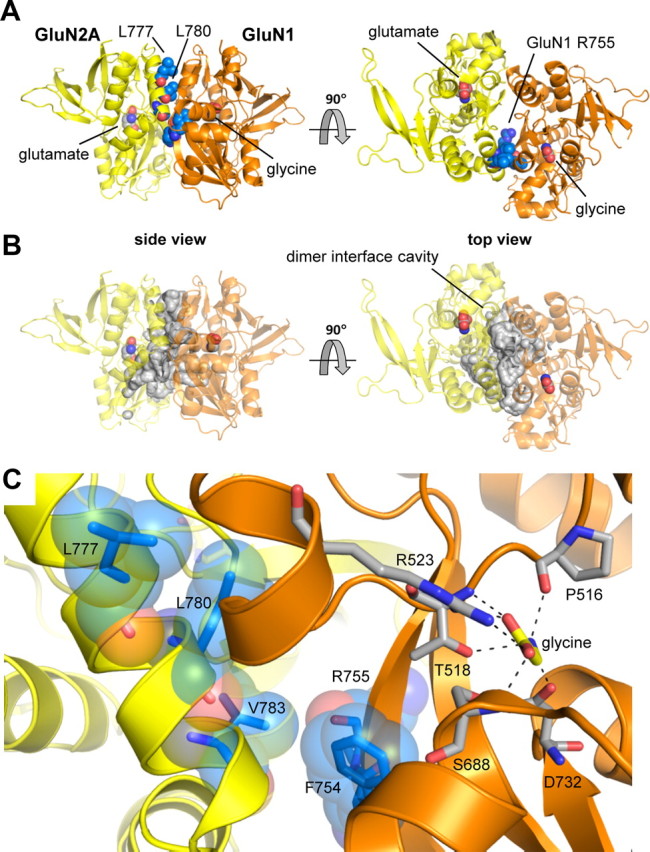
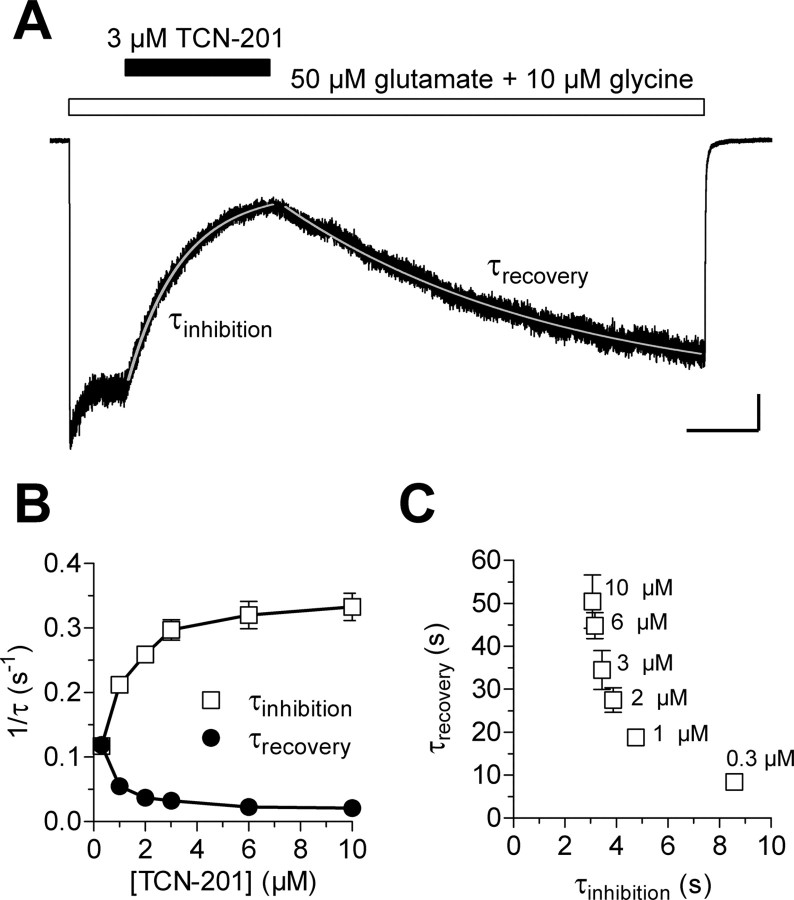
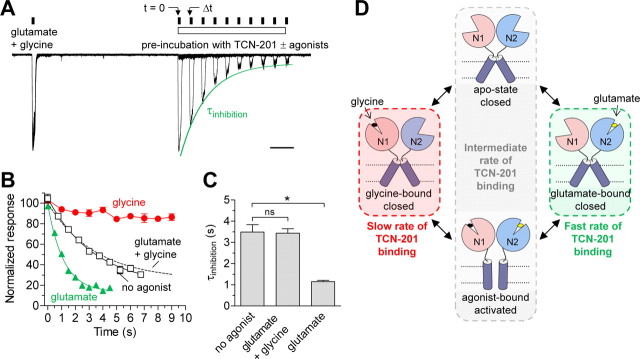
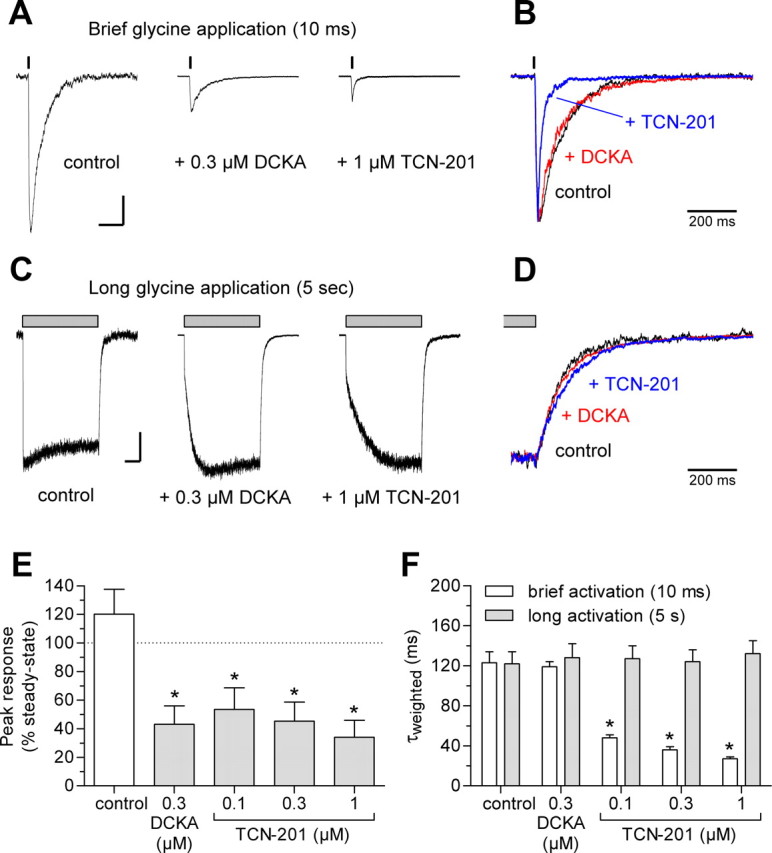
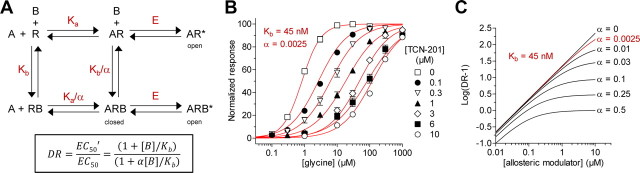
NMDA receptors are ligand-gated ion channels that mediate excitatory neurotransmission in the brain and are involved in numerous neuropathological conditions. NMDA receptors are activated upon simultaneous binding of coagonists glycine and glutamate to the GluN1 and GluN2 subunits, respectively. Subunit-selective modulation of NMDA receptor function by ligand binding to modulatory sites distinct from the agonist binding sites could allow pharmacological intervention with therapeutically beneficial mechanisms. Here, we show the mechanism of action for 3-chloro-4-fluoro-N-[(4-[(2-(phenylcarbonyl)hydrazino)carbonyl]phenyl)methyl]-benzenesulfonamide (TCN-201), a new GluN1/GluN2A-selective NMDA receptor antagonist whose inhibition can be surmounted by glycine. Electrophysiological recordings from chimeric and mutant rat NMDA receptors suggest that TCN-201 binds to a novel allosteric site located at the dimer interface between the GluN1 and GluN2 agonist binding domains. Furthermore, we demonstrate that occupancy of this site by TCN-201 inhibits NMDA receptor function by reducing glycine potency. TCN-201 is therefore a negative allosteric modulator of glycine binding.


Figures

Figure 1.
Figure 1.
TCN-201 binding reduces potency of glycine at the GluN1 subunit. A, Chemical structure of 3-chloro-4-fluoro-N-[(4-[(2-(phenylcarbonyl)hydrazino)carbonyl]phenyl)methyl]-benzenesulfonamide (TCN-201) (Bettini et al., 2010). B, The effects of increasing concentrations of TCN-201 on responses to 100 μm glutamate plus 3 μm glycine from recombinant NMDA receptors expressed in Xenopus oocytes were measured using two-electrode voltage-clamp recordings. Data are from 4–25 oocytes. C, Concentration–response data for TCN-201 inhibition of GluN1/GluN2A activated by 100 μm glutamate plus different concentrations of glycine (1–300 μm). The data obtained in the presence of 300 μm glycine could not be fitted to the Hill equation. Data are from 5–25 oocytes. D, Glutamate concentration–response data for GluN1/GluN2A coactivated by 30 μm glycine in the absence (control) and presence of 3 μm TCN-201. Glutamate EC50 was 3.6 ± 0.2 μm (N = 8) in the absence of TCN-201 and 2.5 ± 0.1 μm (N = 7) in the presence of TCN-201. E, Glycine concentration–response data for GluN1/GluN2A coactivated by 100 μm glutamate in the absence (0 μm) and presence of increasing concentrations of TCN-201. Data are from five to seven oocytes. F, A Schild plot of the glycine concentration–response data produced a pA2 value of 7.53 corresponding to 30 nm and a Schild slope of 0.87 (95% confidence interval, 0.83–0.92). G, d-Serine concentration–response data for GluN1/GluN2A in 100 μm glutamate. Data are from six to eight oocytes. H, A Schild plot of the d-serine concentration–response data produced a pA2 value of 7.39 corresponding to 41 nm and a Schild slope of 0.79 (95% confidence interval, 0.69–0.89). I, d-Cycloserine concentration–response data for GluN1/GluN2A in 100 μm glutamate. Data are from five to seven oocytes for each condition. J, A Schild plot of the d-cycloserine concentration–response data produced a pA2 value of 7.39 corresponding to 41 nm and a Schild slope of 0.90 (95% confidence interval, 0.82–0.98).
Figure 2.
Figure 2.
Structural determinants for TCN-201 activity are located in the S2 segment of the agonist binding domain. A, Linear representations of the polypeptide chains of GluN2A (blue) and GluN2D (gray), as well as chimeric GluN2A-GluN2D subunits (see Materials and Methods for chimeric junctions) show the amino-terminal domain (ATD), S1 and S2 segments of the agonist binding domain, transmembrane helices (M1, M3, and M4), and the reentrant pore loop (M2). B, Bar graph summarizing inhibition by 3 μm TCN-201 of responses to 100 μm glutamate plus 30 μm glycine for wild-type and chimeric GluN2 subunits coexpressed with GluN1. Data are from four to nine oocytes. The asterisk (*) indicates significantly different from GluN1/GluN2A (blue bar) or GluN1/GluN2D (white bar) (p < 0.05; one-way ANOVA with Tukey–Kramer posttest). TCN-201 concentration–response data for inhibition of responses to 100 μm glutamate plus 3 μm glycine were generated for 2A-(2D S1) and 2A-(2D S2) chimeras (C), as well as for 2D-(2A S1) and 2D-(2A S2) chimeras (D) coexpressed with GluN1 in Xenopus oocytes. The dashed lines are data for wild-type NMDA receptors as shown in Figure 1B. Data are from 4–25 oocytes. E, Amino acid sequence alignment of the last residues of the S2 segment from GluN2A-D, which contains the structural determinants for TCN-201 inhibition. The plus sign (+) below the sequences indicates that TCN-201 sensitivity was significantly changed when the residue in GluN2A was mutated. F, Inhibition by 3 μm TCN-201 of responses to 100 μm glutamate plus 30 μm glycine from wild-type and mutant GluN2A subunits coexpressed with GluN1. Data are from four to seven oocytes. The asterisk (*) indicates significantly different from GluN1/GluN2A (blue bar) (p < 0.05; one-way ANOVA with Tukey–Kramer posttest). G, Concentration–response data for TCN-201 inhibition of NMDA receptors activated by 100 μm glutamate plus 3 μm glycine. Data are from 5–10 oocytes. H, TCN-201 IC50 values plotted versus glycine EC50 values for mutant GluN2A subunits. Data for GluN2A V783L are excluded from this analysis, since the TCN-201 IC50 could not be determined for this mutant. There is a significant correlation between glycine EC50 values and TCN-201 IC50 values for the depicted GluN2A mutants (Pearson's test for correlation, r2 = 0.79, p < 0.05). See Table 1 for IC50 values and EC50 values. Error bars indicate SEM.
Figure 3.
Figure 3.
Residue Val783 of GluN2A controls TCN-201 binding. Glycine concentration–response data for GluN1/GluN2A G786D (A), GluN1/GluN2A V783L (C), GluN1/GluN2B F784V (E), and GluN1/GluN2B L783F+F784V (G) in the absence (0 μm) and presence of increasing concentrations of TCN-201. Data are from four to six oocytes. Schild plots for GluN1/GluN2A G786D (B), GluN1/GluN2A V783L (D), GluN1/GluN2B F784V (F), and GluN1/GluN2B L783F+F784V (H) yield pA2 values of 7.40, 5.67, 5.86, and 6.36 corresponding to 40 nm, 2.1 μm, 1.4 μm, and 440 nm, respectively. For all experiments, responses were activated by increasing concentrations of glycine plus 100 μm glutamate. See Table for EC50 values.
Figure 4.
Figure 4.
TCN-201 inhibition is mediated by residues from both GluN1 and GluN2A. A, Residues that are located within 8 Å of residue V783 in GluN2A and have side chains protruding into the dimer interface are highlighted as blue spheres in the structure of the isolated agonist binding domains from GluN1/GluN2A with bound glutamate and glycine (PDB ID 2A5T) (Furukawa et al., 2005). GluN2A is shown in yellow, and GluN1 is shown in orange. The highlighted residues were mutated to alanine to identify additional residues implicated in TCN-201 inhibition. Inhibition by 3 μm TCN-201 of responses to 100 μm glutamate plus 30 μm glycine from mutant GluN1 subunits coexpressed with GluN2A (B) or mutant GluN2A subunits coexpressed with GluN1 (C). Data are from 4–12 oocytes. The asterisk (*) indicates significantly different from wild-type GluN1/GluN2A (blue bar) (p < 0.05; one-way ANOVA with Tukey–Kramer posttest). nr indicates that responses to 100 μm glutamate plus 30 μm glycine were not detected (N = 10–12), suggesting that these mutations have pronounced effects on subunit biosynthesis or receptor function. D, TCN-201 concentration–response data are shown for GluN1 and GluN2A mutants with marked changes in TCN-201 inhibition. Responses to 100 μm glutamate plus 3 μm glycine were measured from receptors expressed in Xenopus oocytes using two-electrode voltage-clamp recordings. The dashed line is data for wild-type GluN1/GluN2A as shown in Figure 1B. Data are from 4–25 oocytes. See Table 1 for IC50 values. Error bars indicate SEM.
Figure 5.
Figure 5.
TCN-201 sensitivity is controlled by the agonist binding domain dimer interface between GluN1 and GluN2. A, Residues Leu777, Leu780, and Val783 of GluN2A, as well as F754 and R755 of GluN1, which substantially influence TCN-201 sensitivity, are located at the dimer interface in the crystal structure of the isolated agonist binding domains from GluN1/GluN2A with bound glutamate and glycine (PDB ID 2A5T) (Furukawa et al., 2005). These residues are highlighted as blue spheres. GluN2A is shown in yellow, and GluN1 is shown in orange. B, The residues that influence TCN-201 sensitivity are lining part of a large water-filled cavity (∼5200 Å3) in the dimer interface that can accommodate a modulatory binding site. The cavity was identified using the CASTp server (Dundas et al., 2006), and the surface of the cavity is highlighted in gray. C, The side chain of GluN2A Val783 (shown as blue sticks with transparent blue spheres) is directly facing the hinge region of the bilobed GluN1 agonist binding domain. The path between GluN2A Val783 and the glycine agonist is blocked by Phe754 and Arg755 in the GluN1 hinge region. GluN2A Leu777 and Leu780 are located two and one helical turns away from Val783 in the dimer interface. The distance (Cα–Cα) between GluN2A Val783 and the glycine agonist in GluN1 is 16 Å. Selected residues important for glycine binding are shown as gray sticks, and interactions with glycine are indicated by black dashed lines.
Figure 6.
Figure 6.
Time course of the onset and recovery of TCN-201 inhibition. A, Representative whole-cell current responses recorded under voltage-clamp from recombinant GluN1/GluN2A receptors expressed in an HEK293 cell using rapid solution exchange. Fitted single-exponential functions are superimposed as white lines. Calibration: Vertical, 100 pA; horizontal, 5 s. B, The rates for the onset of inhibition (1/τinhibition) and recovery from inhibition (1/τrecovery) are plotted versus TCN-201 concentration. Both the time constants for inhibition (τinhibition) and recovery from inhibition (τrecovery) are dependent on the TCN-201 concentration. Data are averaged from three to seven cells for each condition. C, τrecovery is plotted versus τinhibition for the indicated concentrations of TCN-201.
Figure 7.
Figure 7.
TCN-201 binding is differentially modulated by glutamate and glycine binding. A, Representative overlay of 10 paired-pulse whole-cell current recordings from one HEK293 cell expressing recombinant GluN1/GluN2A receptors. The cell was initially stepped into glutamate (50 μm) plus glycine (10 μm) to obtain the control response amplitude before preincubation with TCN-201. Subsequent to this control response, the cell was stepped into TCN-201 without agonists (indicated as time 0, t = 0). The cell was then stepped back into glutamate plus glycine at different time intervals (Δt) on subsequent sweeps. TCN-201 was preincubated either with no agonist, with glutamate alone (50 μm), or with glycine alone (10 μm). TCN-201 binding occurred from t = 0 to Δt, and the time constant for TCN-201 inhibition (τinhibition) was obtained by a monoexponential fit to the response amplitudes at Δt as percentage of control amplitude. The recording shown here is with TCN-201 plus glutamate in the preincubation, and the monoexponential fit is shown as a green line. Calibration, 1 s. B, Time course of TCN-201 inhibition in the presence of either no agonist (white), with glutamate alone (50 μm; green), or with glycine alone (10 μm; red). The dashed line is the time course of TCN-201 inhibition observed in the continuous presence of both glutamate (50 μm) plus glycine (10 μm) as depicted in Figure 6. In the presence of glycine alone, the time course of inhibition could not be reliably determined. Data are averaged from three to seven cells for each condition. C, Mean τinhibition values obtained from individual cells for different conditions. The asterisk (*) indicates significantly different (p < 0.05), and ns indicates not significantly different (p > 0.05) (one-way ANOVA with Tukey–Kramer posttest). D, Diagram scheme depicting differences in TCN-201 binding to the different conformations of the NMDA receptor. Error bars indicate SEM.
Figure 8.
Figure 8.
TCN-201 binding accelerates glycine deactivation. A, Representative whole-cell current responses recorded under voltage clamp from recombinant GluN1/GluN2A receptors expressed in HEK293 cells using rapid solution exchange. The receptors were activated by brief application of 1 mm glycine in the continuous presence of 50 μm glutamate and either no antagonist, 0.3 μm DCKA, or 1 μm TCN-201. Calibration: Vertical, 200 pA; horizontal, 200 ms. B, Overlay of normalized responses from A. C, Representative whole-cell current responses from recombinant GluN1/GluN2A receptors activated by long application of 1 mm glycine in the continuous presence of 50 μm glutamate and either no antagonist, 0.3 μm DCKA, or 1 μm TCN-201. Calibration: Vertical, 200 pA; horizontal, 1 s. D, Overlay of normalized responses from C. E, Mean peak responses from brief applications of glycine as percentage of steady-state responses from long applications of glycine. Data are from six cells. The asterisk (*) indicates significantly different from control (white bar; p < 0.05; one-way ANOVA with Tukey–Kramer posttest). F, Summary of τweighted for glycine deactivation of responses to brief and long glycine applications. Data are from six cells. See Table 2 for τfast and τslow values. The asterisk (*) indicates significantly different from control (p < 0.05; one-way ANOVA with Tukey–Kramer posttest). Error bars indicate SEM.
Figure 9.
Figure 9.
TCN-201 is a negative allosteric modulator of glycine binding. A, Proposed model for TCN-201 inhibition, in which TCN-201 allosterically modulates agonist binding without changing agonist efficacy. A is the agonist glycine, B is the inhibitor TCN-201, and R is the receptor. The dissociation constant for agonist binding (Ka) is changed by an allosteric constant α upon binding of the allosteric modulator. Similarly, the dissociation constant for modulator binding (Kb) is changed by α upon agonist binding. In this model, the agonist efficacy E is not changed upon modulator binding. Positive allosteric modulation is achieved if α > 1 and negative modulation is achieved if α < 1. The relationship describing the dose ratio DR (EC50′/EC50, the ratio of agonist EC50 values in presence and absence of modulator) is shown below. DR is a function of the modulator concentration [B], modulator binding affinity Kb, and the allosteric constant α. B, Analysis of the glycine concentration–response data shown in Figure 1E by directly fitting to the relationship for the dose ratio DR shown in Figure 9A using a global nonlinear regression method (see Materials and Methods). The regression gave a Kb value of 45 nm and an allosteric constant α of 0.0025 for TCN-201 inhibition of GluN1/GluN2A activated by glutamate and glycine. C, Schild plots illustrating the effects of changing the allosteric constant α with constant Kb (45 nm). Low allosteric constants produce Schild plots with only small deviations from the line dictated by the Schild equation (α = 0).

References

    1. Acker TM, Yuan H, Hansen KB, Vance KM, Ogden KK, Jensen HS, Burger PB, Mullasseril P, Snyder JP, Liotta DC, Traynelis SF. Mechanism for noncompetitive inhibition by novel GluN2C/D N-methyl-d-aspartate receptor subunit-selective modulators. Mol Pharmacol. 2011;80:782–795. - PMC - PubMed
    1. Ahmed AH, Ptak CP, Oswald RE. Molecular mechanism of flop selectivity and subsite recognition for an AMPA receptor allosteric modulator: structures of GluA2 and GluA3 in complexes with PEPA. Biochemistry. 2010;49:2843–2850. - PMC - PubMed
    1. Arunlakshana O, Schild HO. Some quantitative uses of drug antagonists. Br J Pharmacol Chemother. 1959;14:48–58. - PMC - PubMed
    1. Benveniste M, Mienville JM, Sernagor E, Mayer ML. Concentration-jump experiments with NMDA antagonists in mouse cultured hippocampal neurons. J Neurophysiol. 1990;63:1373–1384. - PubMed
    1. Bettini E, Sava A, Griffante C, Carignani C, Buson A, Capelli AM, Negri M, Andreetta F, Senar-Sancho SA, Guiral L, Cardullo F. Identification and characterization of novel NMDA receptor antagonists selective for NR2A- over NR2B-containing receptors. J Pharmacol Exp Ther. 2010;335:636–644. - PubMed

Publication types