. 2012 May 2;32(18):6240-50.
doi: 10.1523/JNEUROSCI.0257-12.2012.

Connectivity-based parcellation of the human orbitofrontal cortex

Affiliations

Connectivity-based parcellation of the human orbitofrontal cortex

Thorsten Kahnt et al. J Neurosci. .

Abstract

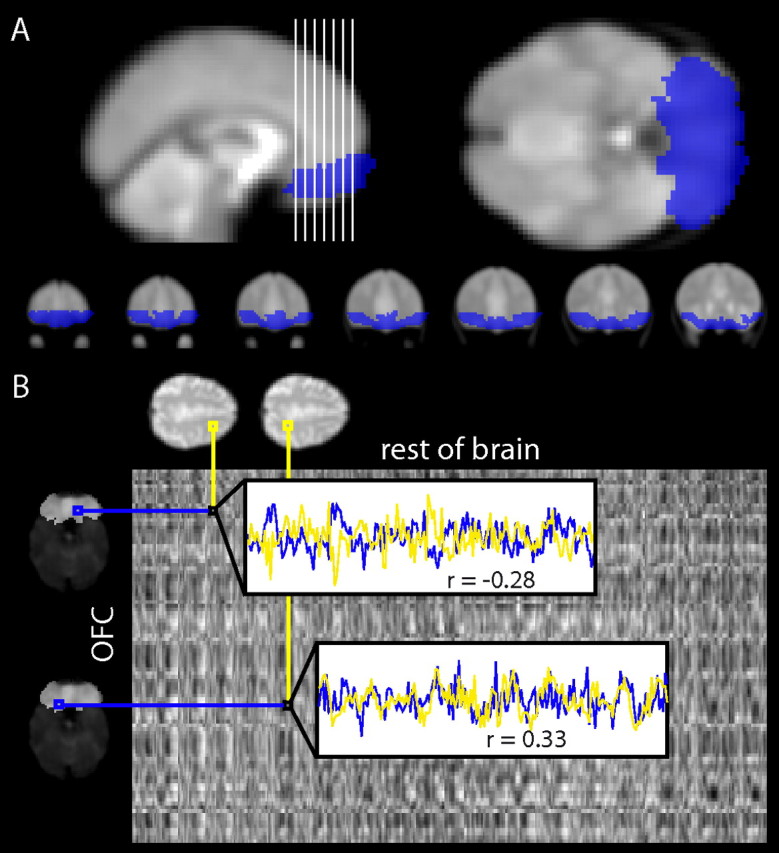
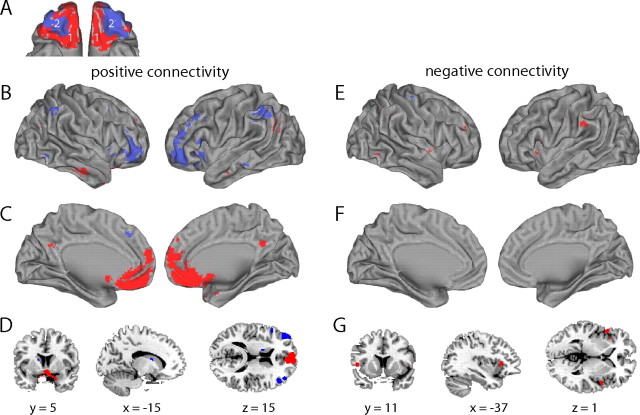
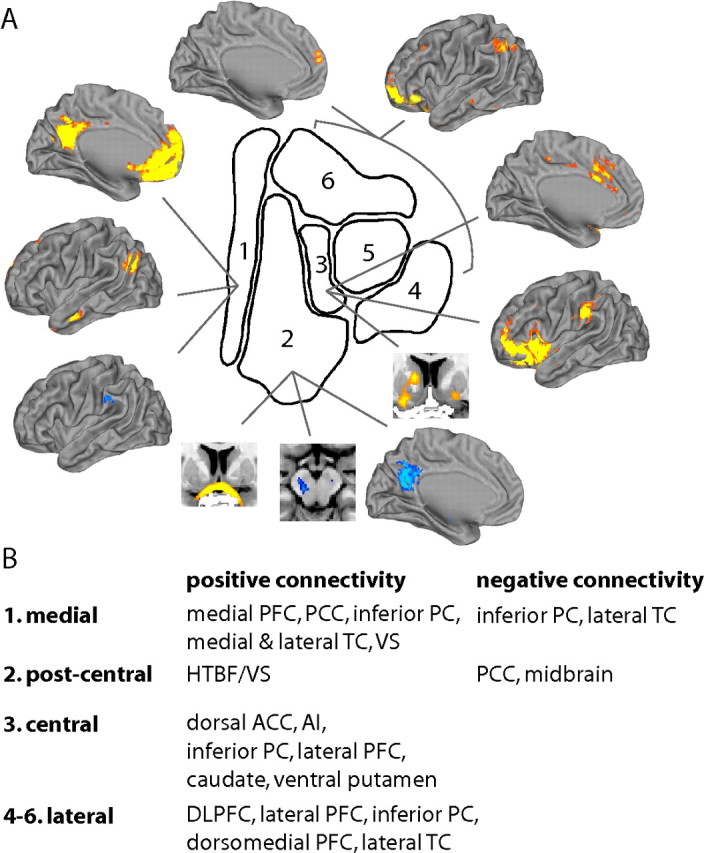
The primate orbitofrontal cortex (OFC) is involved in reward processing, learning, and decision making. Research in monkeys has shown that this region is densely connected with higher sensory, limbic, and subcortical regions. Moreover, a parcellation of the monkey OFC into two subdivisions has been suggested based on its intrinsic anatomical connections. However, in humans, little is known about any functional subdivisions of the OFC except for a rather coarse medial/lateral distinction. Here, we used resting-state fMRI in combination with unsupervised clustering techniques to investigate whether OFC subdivisions can be revealed based on their functional connectivity profiles with other brain regions. Examination of different cluster solutions provided support for a parcellation into two parts as observed in monkeys, but it also highlighted a much finer hierarchical clustering of the orbital surface. Specifically, we identified (1) a medial, (2) a posterior-central, (3) a central, and (4-6) three lateral clusters spanning the anterior-posterior gradient. Consistent with animal tracing studies, these OFC clusters were connected to other cortical regions such as prefrontal, temporal, and parietal cortices but also subcortical areas in the striatum and the midbrain. These connectivity patterns provide important implications for identifying specific functional roles of OFC subdivisions for reward processing, learning, and decision making. Moreover, this parcellation schema can provide guidance to report results in future studies.


Figures

Figure 1.
Figure 1.
OFC region of interest and connectivity patterns. A, Voxels in blue are included in a mask of the OFC comprised of standard AAL labels. This mask is overlaid on a mean EPI image (averaged across time and subjects). Coronal sections on the bottom correspond to white vertical lines on the top left. B, Sketch of an individual OFC-by-rest-of-brain connectivity matrix. Each cell in the matrix corresponds to the correlation between the resting-state activity in an OFC voxel (blue) and a voxel in the rest of the brain (yellow). Each row represents the connectivity profile of one OFC voxel.
Figure 2.
Figure 2.
Intersubject stability of OFC connectivity patterns. A, Map of correlation coefficients depicting the average correlation between the OFC functional connectivity patterns (between activity in OFC and the rest of the brain) of all subjects (average leave-one-out correlation). Coronal sections on the bottom correspond to white vertical lines on the top left. B, Same stability map projected on the cortical surface. C, Histogram of correlation coefficients between the OFC connectivity patterns of different subjects.
Figure 3.
Figure 3.
Connectivity-based parcellation of the human OFC. A–F, Cluster solutions with different K (2–7). See main text and Table 1 for a detailed description of the clusters.
Figure 4.
Figure 4.
Stability, symmetry, and hierarchy of cluster solutions. A, VI based on a split-half reliability analysis (100 random split halves) as a function of K. High VI indicates low stability. All VIs of different Ks are significantly (p < 0.0001) different except for the difference between K = 5 and K = 6 (t = 0.70, p = 0.49). Thus, K = 6 is the optimal K because it is the smallest K in which stability does not decrease relative to K − 1. Error bars for SEM are smaller than the symbols. B, SI as a function of K. SI reflects the percentage of equally labeled voxels in the left and right hemisphere, when mirrored at the midline. Black dots depict empirical SI, and black vertical lines depict the range of SI values based on 106 permutations of random cluster labeling. C, HI as a function of K, reflecting the hierarchical structure of the different solutions by the average probability that a given cluster in K has only one “parent-cluster” in K − 1. Perfect hierarchy results in HI = 1. Black dots depict empirical HI, and black vertical lines depict the range of HI values based on 106 permutations of random cluster labeling.
Figure 5.
Figure 5.
Functional connectivity of OFC subdivisions in the K = 2 cluster solution. A, Color code of different OFC subdivisions. B, Positive resting-state connectivity of different subdivisions with regions on the right (left) and left (right) lateral surface. C, Positive resting-state connectivity of different subdivisions with regions on the right (right) and left (left) medial surface. D, Positive resting-state connectivity of different subdivisions with subcortical regions depicted in coronal (left), sagittal (middle), and transversal (right) sections. Coordinates on the bottom refer to MNI space. E–G, Negative resting-state connectivity of different OFC subdivisions with cortical and subcortical structures. T-maps of resting-state connectivity are thresholded at p < 0.05, FWE whole-brain corrected.
Figure 6.
Figure 6.
Functional connectivity of OFC subdivisions in the K = 6 cluster solution. A, Color code of different OFC subdivisions. B–D, Positive resting-state connectivity of different subdivisions with cortical and subcortical structures. E–G, Negative resting-state connectivity of different OFC subdivisions with cortical and subcortical structures. Coordinates on the bottom refer to MNI space. T-maps of resting-state connectivity are thresholded at p < 0.05, FWE whole-brain corrected.
Figure 7.
Figure 7.
Summary of OFC subdivisions and functional connectivity profiles. A, Schematic view of connectivity based OFC subdivisions (based on the optimal K = 6 cluster solution) along with their connectivity profile to other brain regions. Only the left hemisphere is shown. Regions showing functional connectivity (p < 0.05, FWE corrected) with these clusters are depicted on the surface plots and the sections. B, List of regions to which clusters show functional connectivity. HTBF/VS, Hypothalamic basal forebrain/ventral striatum.

Similar articles

Cited by

References

    1. Balleine BW, Delgado MR, Hikosaka O. The role of the dorsal striatum in reward and decision-making. J Neurosci. 2007;27:8161–8165. - PMC - PubMed
    1. Barbas H, Pandya DN. Architecture and intrinsic connections of the prefrontal cortex in the rhesus monkey. J Comp Neurol. 1989;286:353–375. - PubMed
    1. Beckmann M, Johansen-Berg H, Rushworth MF. Connectivity-based parcellation of human cingulate cortex and its relation to functional specialization. J Neurosci. 2009;29:1175–1190. - PMC - PubMed
    1. Behrens TE, Woolrich MW, Walton ME, Rushworth MF. Learning the value of information in an uncertain world. Nat Neurosci. 2007;10:1214–1221. - PubMed
    1. Biswal BB, Mennes M, Zuo XN, Gohel S, Kelly C, Smith SM, Beckmann CF, Adelstein JS, Buckner RL, Colcombe S, Dogonowski AM, Ernst M, Fair D, Hampson M, Hoptman MJ, Hyde JS, Kiviniemi VJ, Kötter R, Li SJ, Lin CP, et al. Toward discovery science of human brain function. Proc Natl Acad Sci U S A. 2010;107:4734–4739. - PMC - PubMed

Publication types