. 2012 May 2;32(18):6275-87.
doi: 10.1523/JNEUROSCI.0532-12.2012.

Tbr2 is essential for hippocampal lineage progression from neural stem cells to intermediate progenitors and neurons

Affiliations

Tbr2 is essential for hippocampal lineage progression from neural stem cells to intermediate progenitors and neurons

Rebecca D Hodge et al. J Neurosci. .

Abstract

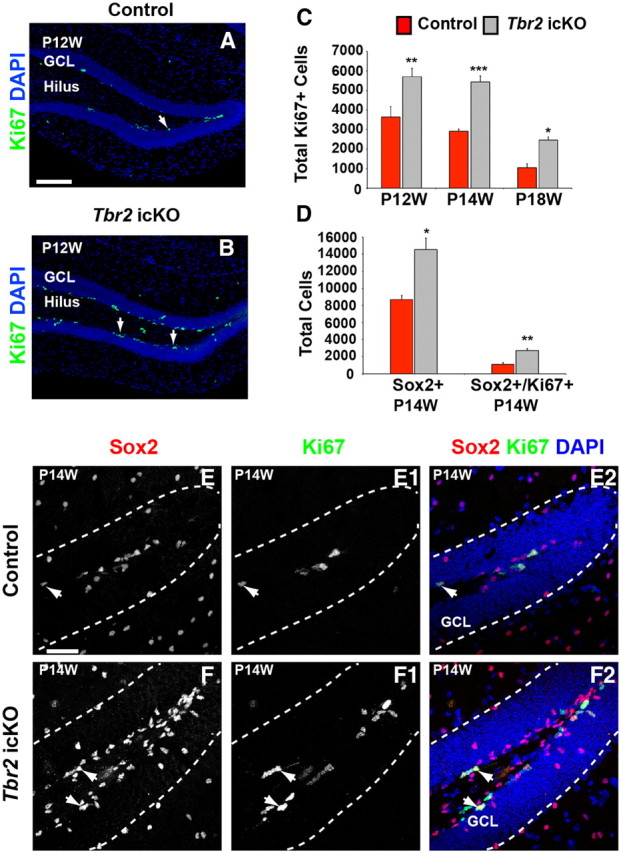
Neurogenesis in the dentate gyrus has been implicated in cognitive functions, including learning and memory, and may be abnormal in major neuropsychiatric disorders, such as depression. Dentate neurogenesis is regulated by interactions between extrinsic factors and intrinsic transcriptional cascades that are currently not well understood. Here we show that Tbr2 (also known as Eomes), a T-box transcription factor expressed by intermediate neuronal progenitors (INPs), is critically required for neurogenesis in the dentate gyrus of developing and adult mice. In the absence of Tbr2, INPs are depleted despite augmented neural stem cell (NSC) proliferation, and neurogenesis is halted as the result of failed neuronal differentiation. Interestingly, we find that Tbr2 likely promotes lineage progression from NSC to neuronal-specified INP in part by repression of Sox2, a key determinant of NSC identity. These findings suggest that Tbr2 expression in INPs is critical for neuronal differentiation in the dentate gyrus and that INPs are an essential stage in the lineage from NSCs to new granule neurons in the dentate gyrus.


Figures

Figure 1.
Figure 1.
Expression of Tbr2 protein throughout DG development. Tbr2 protein is expressed in INPs throughout DG development (red, A–D; grayscale A1–D1) in wild-type mice (C57BL/6). A, A1, The DNe appears adjacent to the cortical hem (CH) by E14.5. Tbr2+ cells are located in the DNe and adjacent dentate SVZ at this time. B, B1, Tbr2+ INPs exit the DG ventricular zone (VZ) and migrate along the DMS to the forming DG on E15.5. C, C1, By P3, Tbr2+ INPs are localized to the SPNZ around the pole of the DG. D, D1, These INPs translocate to the SGZ by P7. E, Live imaging of BAC Tbr2–GFP transgenic mice at P7 shows that the majority of cells in the GCL are derived from a Tbr2-expressing lineage. Continued migration along the DMS to the developing GCL is apparent at this time. Time-lapse imaging of the area of the DMS outlined in the dashed white box in E is shown at higher magnification in F. The dashed white box in F depicts a Tbr2–GFP+ cell undergoing mitosis in the DMS. High-magnification images of the cell outlined in F were acquired every 10 min as shown in F1–F10. Arrowheads in F1–F10 depict the cell undergoing mitosis to form two new Tbr2–GFP+ daughter cells over the course of 90 min, confirming that Tbr2 is expressed in rapidly diving progenitors. HF, Hippocampal fissure; FDJ, fimbriodentate junction. Scale bars: A, B, 100 μm; C–E, 50 μm; F, 20 μm; F10, 15 μm.
Figure 2.
Figure 2.
Increased NSC proliferation and impaired neurogenesis in Tbr2 cKO mice during DG development. A–B2, Increased numbers of Ki67+ and Nestin–GFP+ (NesGFP) progenitor cells are apparent in the DMS and DG in Tbr2 cKO mice (Nestin–Cre;Tbr2flox/flox;Nestin–GFP). VZ, Ventricular zone. Sox2+ cells are increased in the DMS of Tbr2 cKO mice (D–D2) at E16.5 compared with control animals (Nestin–Cre;Tbr2flox/+;Nestin–GFP) (C–C2). Sox2+ cells are increased across multiple ages (E16.5 to P3) in Tbr2 cKO mice (E, red bars) compared with control animals (E, gray bars; ANOVA, n = 3). Ki67+ cells (F) and Ki67+/Sox2+ cells (G) are also significantly increased in Tbr2 cKO mice between E16.5 and P3 (ANOVA, n = 3). H–I1, By P0, the number of NeuroD1+ INPs (type-3 cells) is notably reduced in the DG of Tbr2 cKO mice. J–K3, On P0, the DMS remains visibly expanded in Tbr2 cKO mice, and increased numbers of Nestin–GFP (NesGFP) and Sox2+ cells are readily apparent. At this time, the number of Prox1+ cells is reduced in the forming upper blade of the DG in Tbr2 cKO mice (K2) compared with controls (J2), indicating reduced granule neurogenesis in mutant mice. Scale bar: A, H, 100 μm; J, 50 μm. Graphs represent the mean ± SEM for each group. ***p < 0.001.
Figure 3.
Figure 3.
Ablation of Tbr2 results in loss of INPs and impairs postnatal and adult neurogenesis. A, TAM was administered to mice on P5 and P6, and animals were collected on P19. In control mice (Nestin–CreERT2;Tbr2flox/+;Z/EG), Tbr2 protein is present in the SGZ as expected (B, B1), whereas in Tbr2 icKO mice (Nestin–CreERT2;Tbr2flox/flox;Z/EG) it is essentially absent (C, C1). Highlighted regions in dashed boxes in B and C are shown in higher magnification in B1 and C1, respectively. Markers of INPs (NeuroD1) and neuroblasts (Prox1) are almost completely absent in Tbr2 icKO mice (E, G), whereas they are abundant in controls (D, F). Expression of calretinin (CalR) in new neuroblasts in the SGZ is strongly decreased in mutant mice (G, blue), as is expression of Prox1 (G, red). Use of a reporter strain to monitor the fate of recombined cells (Z/EG, GFP+ cells) shows reduced GFP+ cells with neuronal morphology in Tbr2 icKO mice (C, E, G, I), and fewer GFP+ cells are NeuroD1+ (E) or Prox1+ (G) in mutant mice. At P19, most GFP+ cells are NeuN+ new neurons in control mice (H; region highlighted in dashed box is shown in high magnification in H1), whereas very few GFP+ cells colocalize with NeuN in mutant mice (I, I1, arrows). High-magnification image of cells in Tbr2 icKO mice shows that most GFP+ cells do not have typical neuronal morphology (I1), whereas many GFP+ cells have typical granule neuron morphology in controls (H, H1, arrows). J, Schematic diagram of TAM and BrdU administration to adult mice. After administration of TAM, adult animals were collected at P12W, P14W, and P18W. K–L1, Tbr2 protein expression is present in the SGZ of control animals (Nestin–CreERT2;Tbr2flox/+) at P12W (K, K1, arrows) but is essentially absent from Tbr2 icKO mice (Nestin–CreERT2;Tbr2flox/flox) at this time (L, L1). M–O1, DCX staining of type-3 INPs and new neuroblasts in the SGZ remains consistent between P12W and P18W in control mice, with only a slight apparent reduction attributable to an age-related decline in neurogenesis (M–O, arrows). In Tbr2 icKO mice, DCX+ INPs and neuroblasts are reduced by P12W and continue to decline through P14W (M1–N1, arrows). By P18W, very few DCX+ INPs and neuroblasts remain in Tbr2 icKO mice (O1). P, P1, By P14W, NeuroD1+ INPs and neuroblasts are depleted from the SGZ in Tbr2 icKO mice. Q, Quantification of the total number of NeuroD1+ cells in control and mutant animals confirms decreased numbers of INPs and neuroblasts in Tbr2 icKO mice at P12W and P14W (n = 3, ANOVA, p < 0.01). R–T, BrdU pulse-chase (administered according to the schedule in J) shows that, in control mice, most BrdU+ cells colocalize with NeuN at P14W (R), whereas the proportion of BrdU+ cells coexpressing NeuN is reduced in Tbr2 icKO mice (S, T, orange bars; t test, p < 0.01, n = 4). U, Quantification of the total number of AC3 shows that the number of cells undergoing apoptosis in the SGZ does not differ between control and Tbr2 icKO mice at any stage examined (P19, P12W, P18W; ANOVA, p > 0.05, n = 3). Graphs represent the mean ± SEM for each group. **p < 0.01. Scale bars: B, D, H, K, M, P, 50 μm; B1, H1, K1, 20 μm; R, 100 μm.
Figure 4.
Figure 4.
Proliferation of NSCs is increased after postnatal conditional ablation of Tbr2. A, A1, Most Z/EG GFP+ (Cre recombined) cells are Sox2 in control (Nestin–CreERT2;Tbr2flox/+;Z/EG) mice, consistent with most of these cells being newborn neurons (see Fig. 3). B, B1, In Tbr2 icKO mice (Nestin–CreERT2;Tbr2flox/flox;Z/EG), many GFP+ cells coexpress Sox2, indicating that these cells persist as NSCs in mutant mice. Increased numbers of Sox2+ cells are qualitatively apparent in the SGZ of mutant mice (B, B1, red) versus controls (A, A1, red). C, C1, Ascl1 is discretely expressed in control mice and is present in relatively few GFP+ cells. Consistent with increased Sox2 expression, Ascl1 is also upregulated in the SGZ of Tbr2 icKO mice (D, D1, red), and increased numbers of GFP+ cells coexpress Ascl1 in mutant mice, including some cells with typical radial NSC (type-1) morphology (D1, arrow). E, Quantification of total cell numbers (per DG) shows increased numbers of Sox2+ and Ascl1+ cells (n = 3, ANOVA p < 0.001). F, Correspondingly, Sox2+ and Ascl1+ cells account for a greater proportion of total GFP+ cells in Tbr2 icKO mice compared with controls (n = 3, ANOVA, p < 0.001). G, H, In Tbr2 icKO mice, there is an increase in Ki67+ cells (red) in the SGZ, and many GFP+ cells, including radial NSCs (arrows, H), coexpress Ki67, whereas these cells are extremely rare in control animals (G). I, Quantification of the total number of Sox2+/GFP+ with radial (type-1) NSC morphology shows no significant difference between groups. However, the total number of Sox2+/GFP+ cells with horizontal (type-2a) NSC morphology is significantly increased in Tbr2 icKO mice (I; t test, n = 3). J, The total number of Ki67+/GFP+ cells is significantly increased in Tbr2 icKO mice (n = 3, t test). Similarly, the total number of proliferating (Ki67+/GFP+) cells with radial NSC morphology is increased in Tbr2 icKO mice, as is the total number of Ki67+/GFP+ horizontal NSCs (J; n = 3, t test). K, Correspondingly, Ki67+/GFP+ radial NSCs and horizontal NSCs account for a greater proportion of the total number of Z/EG GFP+ cells in mutant mice (n = 3, t test). A1, B1, C1, and D1 are high-magnification images of regions outlined in dashed boxes in A, B, C, and D. Graphs represent the mean ± SEM for each group. *p < 0.05, **p < 0.01, ***p < 0.001. Scale bars: A, G, 50 μm; A1, 25 μm.
Figure 5.
Figure 5.
NSC proliferation is increased after conditional Tbr2 ablation during adult neurogenesis. A, B, Ki67+ cells are increased in Tbr2 icKO mice (Nestin–CreERT2;Tbr2flox/flox) (B) compared with controls (Nestin–CreERT2;Tbr2flox/+) (A), indicating increased overall proliferation in mutant mice as early as P12W. C, Quantification of Ki67+ cells in control (red bars) and Tbr2 icKO (gray bars) mice illustrates increased Ki67+ cells on P12W, P14W, and P18W, suggesting persistent upregulation of proliferation in mutant mice (ANOVA, n = 3). D, The total number of Sox2+ NSCs in the SGZ is increased in Tbr2 icKO mice (n = 3, t test, p < 0.05) as is the total number of proliferating Sox2+/Ki67+ cells (n = 3, t test, p < 0.01) at P14W. E–F2, Single-channel images of Sox2+ (E, controls; F, Tbr2 icKO) and Ki67+ (E1, controls; F1, Tbr2 icKO) cells illustrate accumulation of these cell populations in the SGZ of Tbr2 icKO mice at P14W. Merged images (E2, control; F2, Tbr2 icKO, arrows) illustrate increased Sox2+/Ki67+ cells in Tbr2 icKO mice. Graphs represent the mean ± SEM for each group. *p < 0.05, **p < 0.01, ***p < 0.001. Scale bars: A, 100 μm; E, 50 μm.
Figure 6.
Figure 6.
Tbr2 suppresses expression of Sox2 and Ascl1 in NSCs and binds the Sox2 locus. A, NSCs transduced with control virus (CAG–GFP) highly express Sox2, and many GFP+ cells are Sox2+ (arrows). B, In NSCs transduced with Tbr2 expressing virus (CAG–Tbr2–ires–GFP), few GFP+/Sox2+ cells are apparent. C, D, Many control GFP+ cells coexpress Ascl1, and very few cells expressing CAG–Tbr2–ires–GFP coexpress Ascl1. E, Quantification of the proportion of GFP+ cells expressing Sox2 and Ascl1 in CAG–GFP (blue bars) and CAG–Tbr2–ires–GFP (purple bars) transduced NSC cultures (n = 5, t test, ***p < 0.001). F, Tbr2 binding is enriched at T-box binding sites (red T) identified in the mouse Sox2 locus. Blue dashes illustrate regions of the Sox2 locus over which primer sets were designed. F, Tbr2 ChIP shows enrichment of Tbr2 at all three candidate T-box binding sites with the highest enrichment at the T-box binding site nearest the Sox2 transcriptional start site. G–K2, Electroporation of constructs expressing control GFP (G, H–H2), Tbr2–VP16 (I–I2), Tbr2–ires–GFP (Tbr2–GFP) (J–J2), or Tbr2–enR (K–K2) was conducted at E16.5, and embryos were examined 2 d later. G, Low-magnification image of the area of the developing hippocampal field targeted during electroporation. H–H2, Many control GFP+ cells coexpress Sox2 protein, as do many of the GFP+ cells electroporated with the activator Tbr2–VP16 construct (I–I2). However, the number of GFP+/Sox2+ cells is significantly reduced in cells expressing either Tbr2–GFP (J–J2) or the repressor Tbr2–enR (K–K2). L, Quantification of the percentage of GFP+ cells expressing Sox2 protein after electroporation with the constructs listed above (ANOVA, p < 0.001, n = 5). Graphs represent the mean ± SEM. ***p < 0.001. Scale bars: A, 25 μm; G, 100 μm; H, 20 μm.
Figure 7.
Figure 7.
Schematic diagram summarizing the effects of Tbr2 knock-out on the stem cell niche in the DG. A, In control animals, type-1 Sox2+ NSCs (green) give rise to Tbr2+ INPs (light green) that in turn produce type-3 INPs (yellow) and neuroblasts, which differentiate into immature granule neurons (orange). Should these cells survive, they ultimately become integrated into the GCL as mature neurons (red). In controls, Tbr2 represses expression of Sox2 as neuronal fate commitment is initiated, as illustrated by the solid line in A connecting these two TFs. The NSC pool is dynamically regulated by INPs and/or neuroblasts as illustrated by the dashed arrows demonstrating feedback from the INPs/neuroblasts onto the NSC pool in A. B, In Tbr2 knock-out animals, Tbr2-mediated repression of Sox2 is absent. NSCs are activated (pink nuclei) at a greater frequency in Tbr2 knock-out mice, resulting in more proliferation of these cells and their subsequent accumulation in the SGZ. In the absence of Tbr2 expression, NSCs fail to differentiate to produce INPs and, accordingly, new granule neurons are not produced.

Similar articles

Cited by

References

    1. Ables JL, Decarolis NA, Johnson MA, Rivera PD, Gao Z, Cooper DC, Radtke F, Hsieh J, Eisch AJ. Notch1 is required for maintenance of the reservoir of adult hippocampal stem cells. J Neurosci. 2010;30:10484–10492. - PMC - PubMed
    1. Arnold SJ, Huang GJ, Cheung AF, Era T, Nishikawa S, Bikoff EK, Molnár Z, Robertson EJ, Groszer M. The T-box transcription factor Eomes/Tbr2 regulates neurogenesis in the cortical subventricular zone. Genes Dev. 2008;22:2479–2484. - PMC - PubMed
    1. Bedogni F, Hodge RD, Elsen GE, Nelson BR, Daza RA, Beyer RP, Bammler TK, Rubenstein JL, Hevner RF. Tbr1 regulates regional and laminar identity of postmitotic neurons in developing neocortex. Proc Natl Acad Sci U S A. 2010;107:13129–13134. - PMC - PubMed
    1. Bonaguidi MA, Wheeler MA, Shapiro JS, Stadel RP, Sun GJ, Ming GL, Song H. In vivo clonal analysis reveals self-renewing and multipotent adult neural stem cell characteristics. Cell. 2011;145:1142–1155. - PMC - PubMed
    1. Breunig JJ, Silbereis J, Vaccarino FM, Sestan N, Rakic P. Notch regulates cell fate and dendrite morphology of newborn neurons in the postnatal dentate gyrus. Proc Natl Acad Sci U S A. 2007;104:20558–20563. - PMC - PubMed

Publication types