. 2012 May 2;32(18):6373-90.
doi: 10.1523/JNEUROSCI.5624-11.2012.

Duration tuning across vertebrates

Affiliations

Duration tuning across vertebrates

Brandon Aubie et al. J Neurosci. .

Abstract

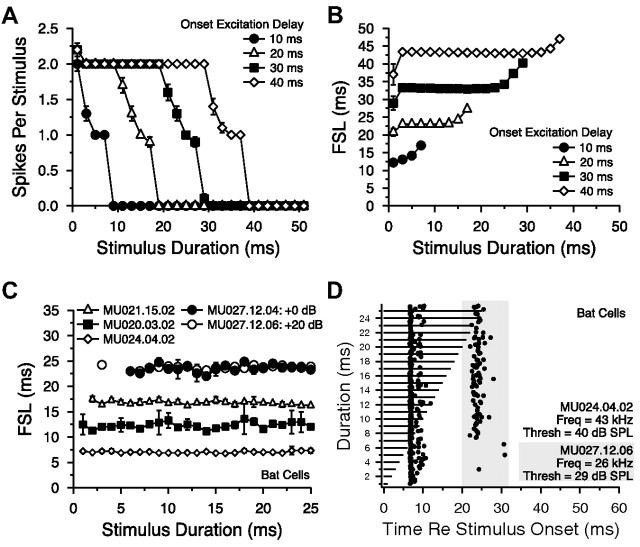
Signal duration is important for identifying sound sources and determining signal meaning. Duration-tuned neurons (DTNs) respond preferentially to a range of stimulus durations and maximally to a best duration (BD). Duration-tuned neurons are found in the auditory midbrain of many vertebrates, although studied most extensively in bats. Studies of DTNs across vertebrates have identified cells with BDs and temporal response bandwidths that mirror the range of species-specific vocalizations. Neural tuning to stimulus duration appears to be universal among hearing vertebrates. Herein, we test the hypothesis that neural mechanisms underlying duration selectivity may be similar across vertebrates. We instantiated theoretical mechanisms of duration tuning in computational models to systematically explore the roles of excitatory and inhibitory receptor strengths, input latencies, and membrane time constant on duration tuning response profiles. We demonstrate that models of duration tuning with similar neural circuitry can be tuned with species-specific parameters to reproduce the responses of in vivo DTNs from the auditory midbrain. To relate and validate model output to in vivo responses, we collected electrophysiological data from the inferior colliculus of the awake big brown bat, Eptesicus fuscus, and present similar in vivo data from the published literature on DTNs in rats, mice, and frogs. Our results support the hypothesis that neural mechanisms of duration tuning may be shared across vertebrates despite species-specific differences in duration selectivity. Finally, we discuss how the underlying mechanisms of duration selectivity relate to other auditory feature detectors arising from the interaction of neural excitation and inhibition.


Figures

Figure 1.
Figure 1.
Conductances (A, B) and current (C, D) of AMPA, NMDA, and GABAA receptors and resulting membrane voltage (E, F) over time for single stimulus presentations to the default computational model using the coincidence detection mechanism of duration tuning. Shown are model inputs and responses to a long (25 ms) stimulus that does not evoke spikes (A, C, E) and a short (5 ms) stimulus that always evokes a spike (B, D, F). Stimulus duration represented by gray bars on time axes.
Figure 2.
Figure 2.
Two representations of the coincidence detection and anti-coincidence mechanisms of duration tuning. A, C, The top trace represents the membrane potential of the model DTN in response to a BD stimulus (bold trace) and to stimuli not at BD (shades of gray, with lighter grays corresponding to responses evoked by stimuli further from BD). The bottom three traces represent the magnitude and timing of synaptic inputs to the DTN at BD (bold) and not at BD (shades of gray). Inputs are as follows: an onset-evoked transient excitation (second trace), an offset-evoked transient excitation (third trace), and an onset-evoked sustained inhibition (fourth trace) that grows with stimulus duration. Stimulus duration is represented by horizontal bars below traces. The black bars represent the BD stimulus; the gray bars represent stimuli not at BD, with lighter grays corresponding to stimuli further from BD. Excitatory input latencies in the coincidence detection mechanism were set so that the maximum temporal coincidence (vertical dashed line) occurred at an intermediate stimulus duration resulting in a bandpass DTN. For the anti-coincidence mechanism, the vertical dashed line is the first point when there is no temporal coincidence between the excitatory and inhibitory inputs. B, D, Schematic dot raster displays illustrating how temporal interaction of excitatory and inhibitory inputs result in offset spiking responses in the bandpass and short-pass DTNs. The latency and time course of excitatory (white) and inhibitory (gray) inputs, and the zone of high spiking probability by the DTN (black), are illustrated for a range of stimulus durations. Maximum spiking (*) occurs to the BD stimulus. Stimulus durations are shown as horizontal black lines. The axes are intentionally unlabeled to highlight the timescale invariance of the models.
Figure 3.
Figure 3.
Response properties of the default model of the coincidence detection mechanism of duration tuning. A, Membrane potential as a function of time (re stimulus onset) of the onset-responding (gray line) and offset-responding (black line) presynaptic input neurons, and of the model short-pass DTN (bold line) for a single stimulus presentation at nine different pulse durations. For clarity, the time course of spikes from the population of 10 inhibitory input neurons is represented as hatched lines above time axes. Stimuli are represented by gray bars below time axes. B, Dot raster display of the spiking responses (black dots) of the short-pass model DTN over 20 repeated trials for stimuli varied in duration from 1 to 25 ms. Timing of the excitatory (white) and inhibitory (gray) inputs to the model DTN are overlaid. Stimuli are represented by black lines on the y-axis. C, Duration tuning profile showing mean ± SE spikes per stimulus as a function of stimulus duration. The default short-pass model DTN has a BD of 1 ms. D, Mean ± SE FSL of default model cell. E, Neural circuit diagram of default model. Inputs to the DTN are shown with excitatory (filled circles) or inhibitory (open circle) connections, with synaptic latencies beside each connection.
Figure 4.
Figure 4.
Nonlinear change in first-spike latency. A, Dot raster display of an in vivo short-pass DTN from the ICc of a big brown bat showing a nonlinear increase in FSL with increasing stimulus duration. The FSL remains stable at short stimulus durations (1–3 ms) but increases to follow stimulus offset at longer durations. B, Change in FSL in four in vivo DTNs from the ICc of the bat compared with FSLs generated by two versions of the coincidence detection model of duration tuning: the default model with standard and with decreased inhibition. Mean FSLs at each duration were shifted by FSLshifted = FSLabsolute − FSLmindur + mindur − 1 so that the shortest stimulus duration that a cell responds to is on the line y = x − 1, dotted line. First-spike latency changes in a nonlinear manner in both in vivo and model responses. The black-filled circles show responses of the default model using standard inhibition (GABAA = 2.5 nS), whereas the gray-filled circles are responses of the model using decreased inhibition (GABAA = 1.5 nS). UW231.04.7: BEF, 41 kHz; threshold, 74 dB SPL; amp, +20 dB (re threshold); 15 trials per stimulus; unpublished recording from dataset in the study by Faure et al. (2003), their Figure 6A; MU016.02.3: BEF, 45 kHz; threshold, 49 dB SPL; amp, +0 dB; 10 trials per stimulus; MU017.13.2: BEF, 39 kHz; threshold, 59 dB SPL; amp, +10 dB; 10 trials per stimulus; MU025.12.3: BEF, 49 kHz; threshold, 48 dB SPL; amp, +10 dB, 15 trials per stimulus.
Figure 5.
Figure 5.
Distribution of FSL slope at short and long durations for in vivo DTNs from the ICc of the bat. Histograms are shown for 38 DTNs (15 short-pass and 23 bandpass) tested at +10 dB (left column), +20 dB (middle column), and/or +30 dB (right column) re threshold. To capture the nonlinear change in FSL observed from in vivo recordings, we calculated separate FSL slopes for responses evoked at short (1–3 ms; top row) and longer stimulus durations (≥3 ms; bottom row). Slopes were calculated by a performing linear regression on the mean FSL data within each duration range. Responses were included only if spikes were evoked with a probability ≥0.25 (i.e., if the cell responded with ≥1 spike on 25% of trials). If a neuron responded only to short (1–3 ms) or only to long (≥3 ms) duration signals, its calculated slope was included in only one of the two distributions. The number of neurons appearing in both distributions at each level above threshold was as follows: +10 dB, n = 22; +20 dB, n = 17; and +30 dB, n = 12.
Figure 6.
Figure 6.
Modifying the latency of onset-evoked excitation to the model DTN. A, Mean ± SE spike count as a function of stimulus duration at four onset-evoked excitatory input latencies (including 10 ms as in the default model). Note how the model produced a short-pass DTN at all onset latencies; however, the temporal bandwidth of tuning widened and the model exhibited less selectivity at longer onset-evoked excitation latencies. B, Mean ± SE FSL of the model responses from A. C, Mean ± SE FSL of four onset-responding neurons (not duration-tuned) from the ICc of the big brown bat. Responses from cell MU027.12 are shown twice: once at threshold and once at +20 dB re threshold. Notice how FSL for this cell remains stable and that the minimum duration threshold remains relatively constant over the 20 dB amplitude range. D, Dot raster display of two onset cells from the ICc of the bat in C. Spikes from the second neuron appear in the gray box. The longer-latency onset neuron has a minimum stimulus duration threshold of 6 ms. MU020.03.02: BEF, 59 kHz; threshold, 56 dB SPL; amp, +10 dB (re threshold); 10 trials per stimulus; MU021.15.02: BEF, 36 kHz; threshold, 57 dB SPL; amp, +10 dB; 10 trials per stimulus; MU024.04.02: BEF, 43 kHz; threshold, 40 dB SPL; amp, +30 dB; 10 trials per stimulus; MU027.12.04: BEF, 26 kHz; threshold, 29 dB SPL; amp, +0 dB; 10 trials per stimulus; MU027.12.06: BEF, 26 kHz; threshold, 29 dB SPL; amp, +20 dB; 10 trials per stimulus.
Figure 7.
Figure 7.
Modifying the passive membrane time constant (τ) of the model DTN. A, C, Mean ± SE spike count as a function of stimulus duration for nine different membrane (τ values). The model DTN produced a short-pass response profile at every τ value. Maximum spike count and temporal bandwidth of duration tuning grew with increasing τ. Stimulus durations up to 200 ms were included to illustrate that model cell spiking eventually ceased. B, D, Model cell FSL as a function of stimulus duration and membrane τ. E, Duration tuning response bandwidth as a function of membrane τ. Temporal bandwidth was defined as the range of stimulus durations with ≥0.5 spikes per trial. The gray line represents best fit exponential regression y = AeBx, where A = 0.6075 and B = 0.5623 (R2 = 0.9055; p = 0.000078).
Figure 8.
Figure 8.
Modifying the strength of AMPA (A, B), NMDA (C, D), and GABAA (E, F) receptor conductances of the model DTN. A, C, E, Mean ± SE spike count as a function of stimulus duration. As expected, increasing the level of excitation or decreasing the strength of GABAergic inhibition to the model DTN increased the maximum spike count and temporal bandwidth of duration tuning. B, D, F, The FSL of each model generally followed stimulus offset except when the excitation (inhibition) was strong (weak) enough for the onset-evoked excitation to reliably evoke spikes at a constant latency from stimulus onset.
Figure 9.
Figure 9.
Reproduction of a bandpass DTN in a bat. A, Dot raster display of model responses over 20 repeated trials with excitatory (white) and inhibitory (gray) inputs overlaid. B, Dot raster display of an in vivo big brown bat DTN over 15 trials presented at +20 dB re threshold. This neuron also produced errant responses with a probability of 0.33–0.4 spikes per trial between 50 and 100 ms (data not shown). C, Mean ± SE spike counts in both the model and the in vivo bat DTN as a function of stimulus duration. D, Mean ± SE FSL in both the model and in vivo bat DTN as a function of stimulus duration. E, Neural circuit diagram of model used to reproduce in vivo bat DTN responses.
Figure 10.
Figure 10.
Reproduction of a bandpass DTN in a rat [Pérez-González et al. (2006), their Fig. 7A,B, unit 39.164]. A, Dot raster display of model responses over 20 repeated trials with excitatory (white) and inhibitory (gray) inputs overlaid. B, Dot raster display of an in vivo rat DTN over 10 trials. C, Mean (±SE) spike count (model only) of model and in vivo rat DTN as a function of stimulus duration. Model spiking was highly variable across trials due to noisy inhibition; hence responses are shown after 20 and 1000 repeated trials. High response variability was also observed from the in vivo rat DTN. D, Mean (±SE) FSL (model only) of model and in vivo rat DTN as a function of stimulus duration. E, Neural circuit diagram of model used to reproduce in vivo rat DTN responses.
Figure 11.
Figure 11.
Reproduction of a short-pass DTN in a mouse [Brand et al. (2000), their Fig. 3, cell m-10-02-98]. A, Dot raster display of model responses over 20 repeated trials with excitatory (white) and inhibitory (gray) inputs overlaid. B, Mean (±SE) spike count (model only) of model and in vivo mouse DTN as a function of stimulus duration. C, Mean (±SE) FSL (model only) of model and in vivo mouse DTN as a function of stimulus duration. D, Neural circuit diagram of model used to reproduce in vivo mouse DTN responses.
Figure 12.
Figure 12.
Reproduction of a short-pass DTN in a frog [Leary et al. (2008), their Fig. 5, open diamonds]. A, Dot raster display of model responses over 20 repeated trials with excitatory (white) and inhibitory (gray) inputs overlaid. B, Mean (±SE) spike count (model only) of model and in vivo frog DTN as a function of stimulus duration. C, Mean (±SE) FSL (model only) of model and in vivo frog DTN as a function of stimulus duration. D, Neural circuit diagram of model used to reproduce in vivo frog DTN responses.

Similar articles

Cited by

References

    1. Aubie B, Becker S, Faure PA. Computational models of millisecond level duration tuning in neural circuits. J Neurosci. 2009;29:9255–9270. - PMC - PubMed
    1. Brand A, Urban R, Grothe B. Duration tuning in the mouse auditory midbrain. J Neurophysiol. 2000;84:1790–1799. - PubMed
    1. Brugge JF. An overview of central auditory processing. In: Popper AN, Fay RR, editors. The mammalian auditory pathway: neurophysiology. New York: Springer; 1992. pp. 1–33.
    1. Burger RM, Pollak GD. Analysis of the role of inhibition in shaping responses to sinusoidally amplitude-modulated signals in the inferior colliculus. J Neurophysiol. 1998;80:1686–1701. - PubMed
    1. Carnevale NT, Hines ML. The NEURON book. Cambridge, UK: Cambridge UP; 2006.

Publication types

LinkOut - more resources