. 2012 May 2;32(18):6391-410.
doi: 10.1523/JNEUROSCI.6221-11.2012.

Genomic analysis of reactive astrogliosis

Affiliations

Genomic analysis of reactive astrogliosis

Jennifer L Zamanian et al. J Neurosci. .

Abstract

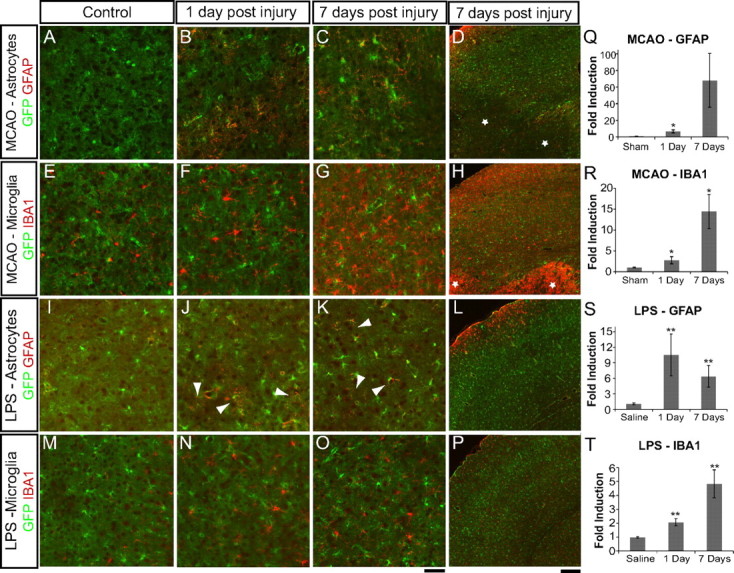
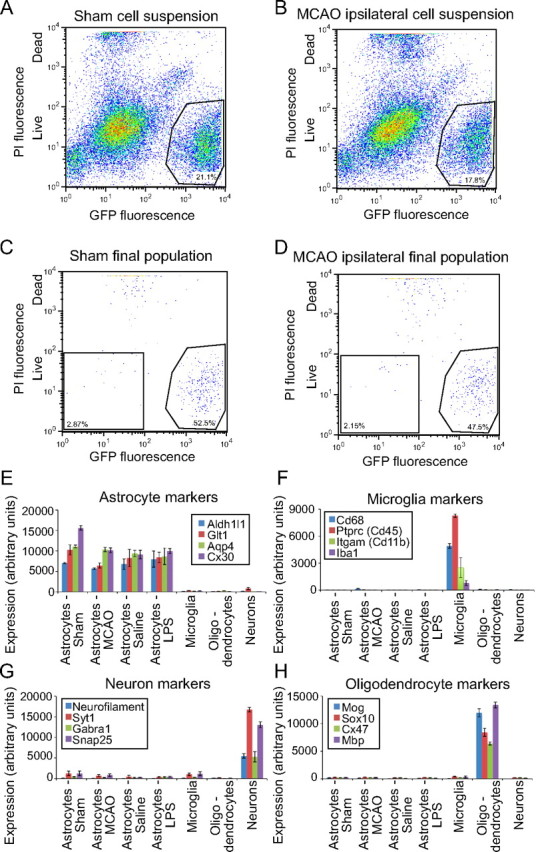
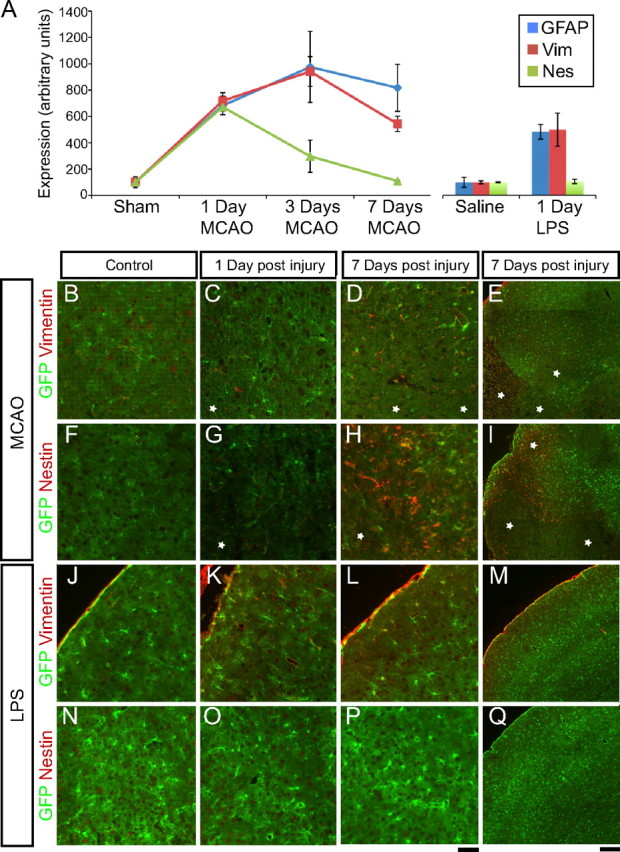
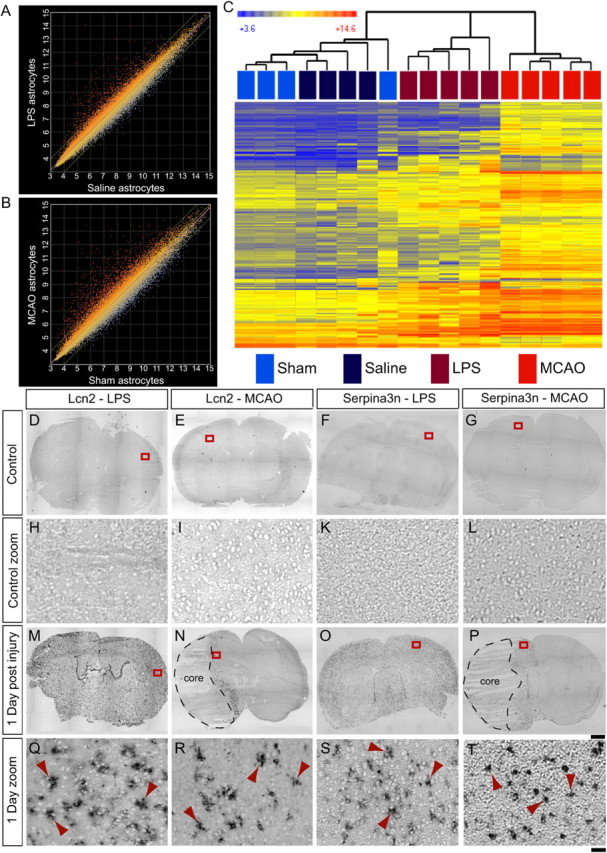
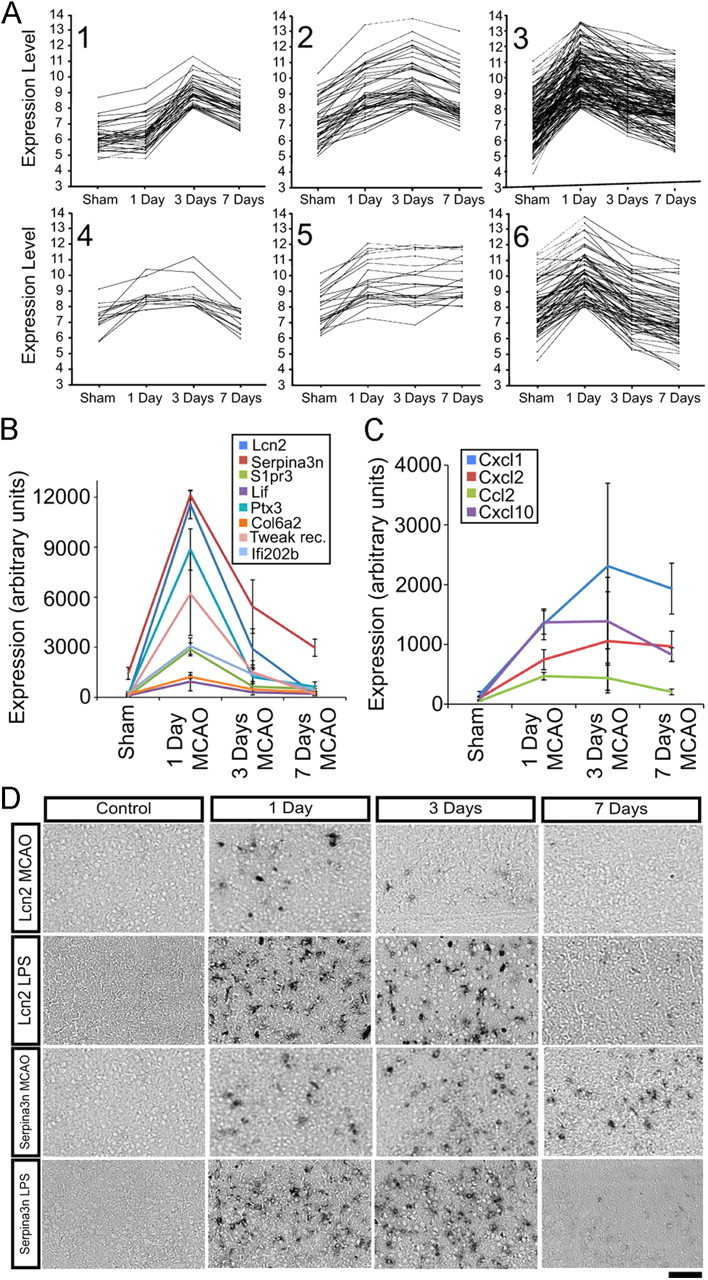
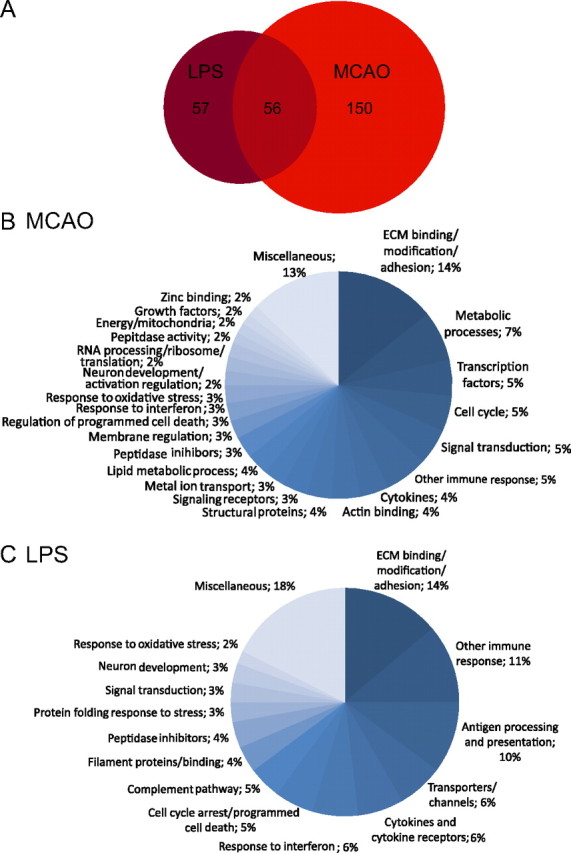
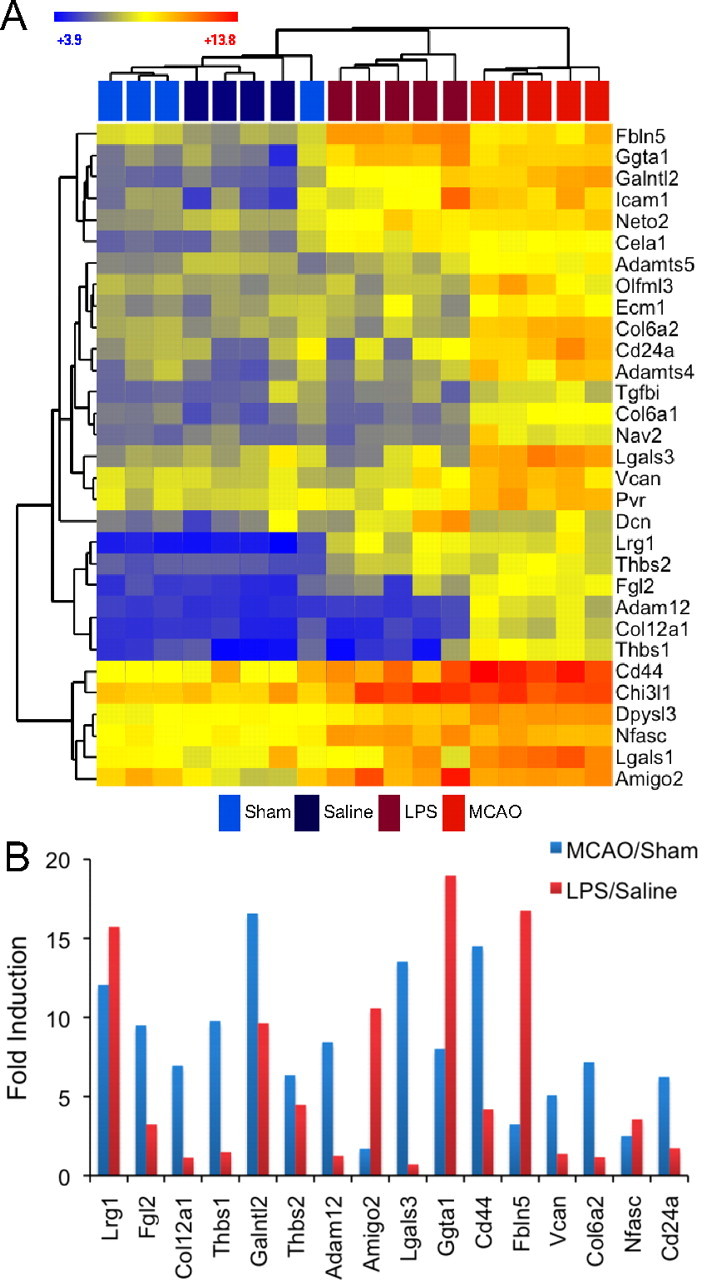
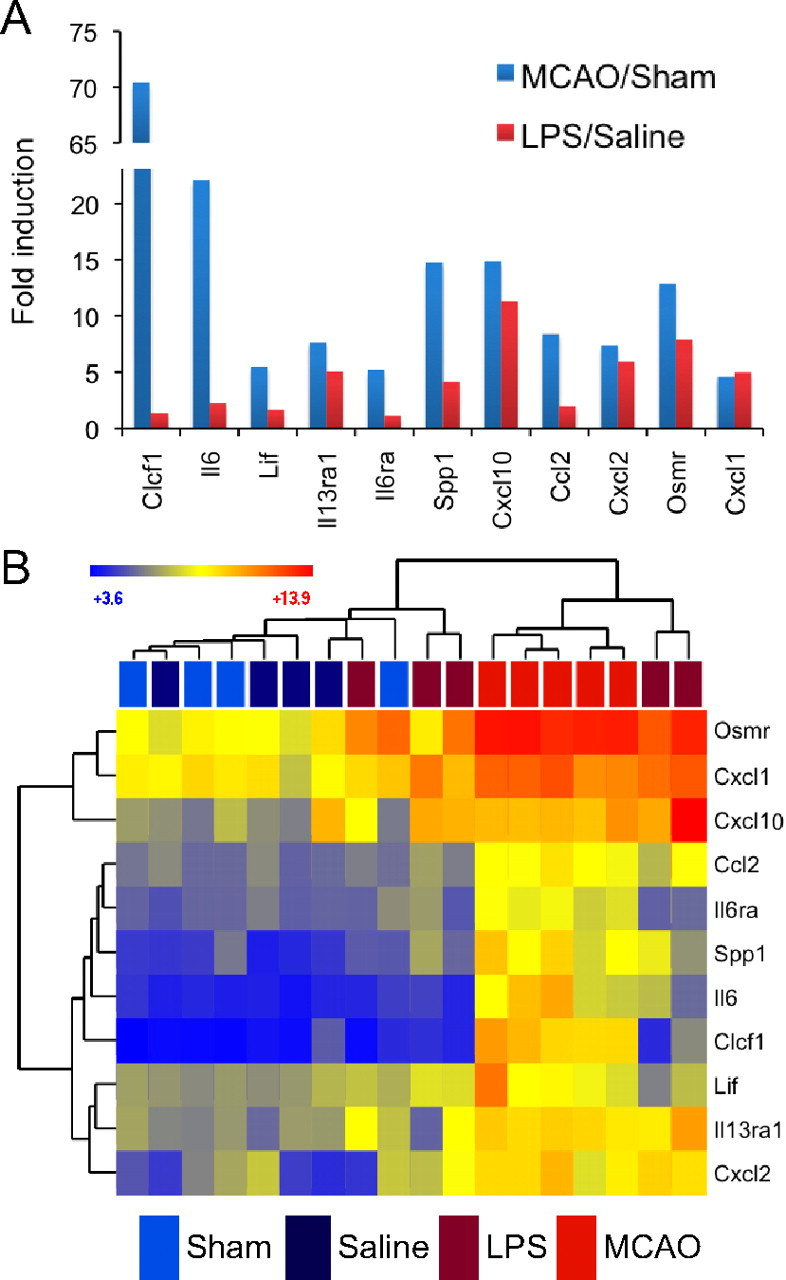
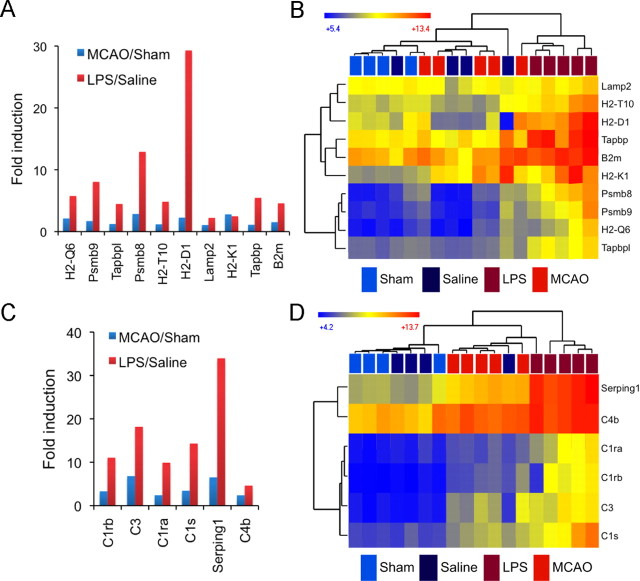
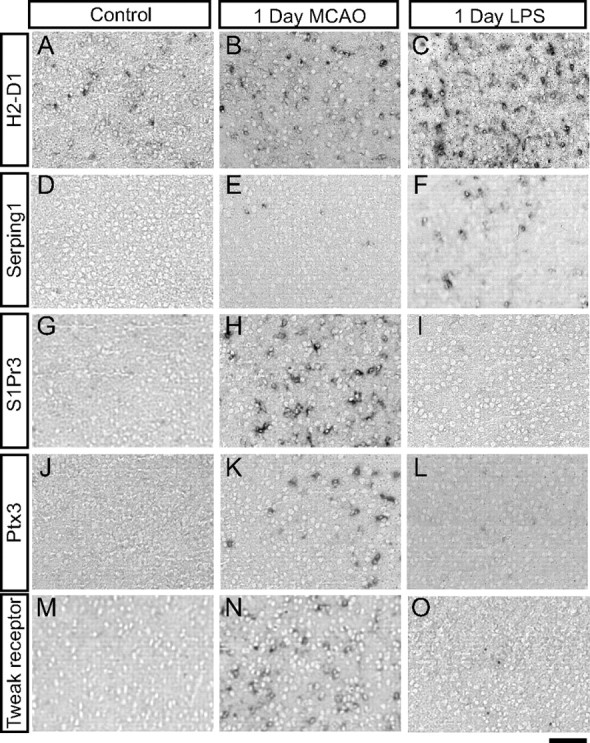
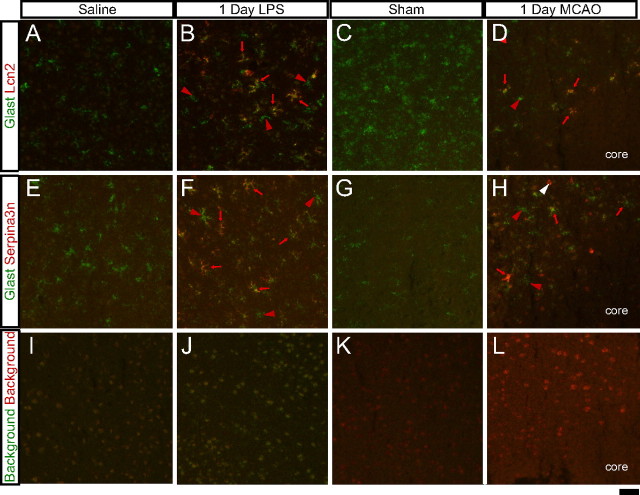
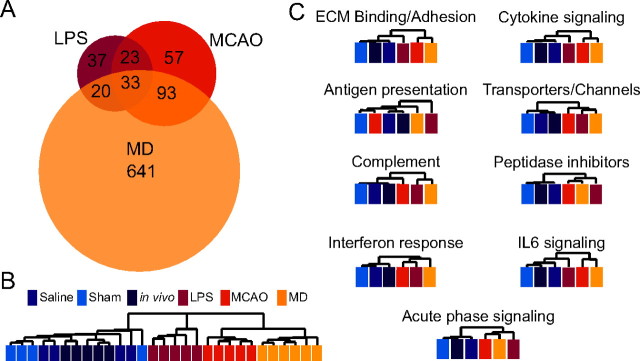
Reactive astrogliosis is characterized by a profound change in astrocyte phenotype in response to all CNS injuries and diseases. To better understand the reactive astrocyte state, we used Affymetrix GeneChip arrays to profile gene expression in populations of reactive astrocytes isolated at various time points after induction using two mouse injury models, ischemic stroke and neuroinflammation. We find reactive gliosis consists of a rapid, but quickly attenuated, induction of gene expression after insult and identify induced Lcn2 and Serpina3n as strong markers of reactive astrocytes. Strikingly, reactive astrocyte phenotype strongly depended on the type of inducing injury. Although there is a core set of genes that is upregulated in reactive astrocytes from both injury models, at least 50% of the altered gene expression is specific to a given injury type. Reactive astrocytes in ischemia exhibited a molecular phenotype that suggests that they may be beneficial or protective, whereas reactive astrocytes induced by LPS exhibited a phenotype that suggests that they may be detrimental. These findings demonstrate that, despite well established commonalities, astrocyte reactive gliosis is a highly heterogeneous state in which astrocyte activities are altered to respond to the specific injury. This raises the question of how many subtypes of reactive astrocytes exist. Our findings provide transcriptome databases for two subtypes of reactive astrocytes that will be highly useful in generating new and testable hypotheses of their function, as well as for providing new markers to detect different types of reactive astrocytes in human neurological diseases.


Figures

Figure 1.
Figure 1.
Middle cerebral artery occlusion and systemic LPS injection induce astrogliosis and microglia activation. Immunofluorescent detection of gliosis markers used 10 μm fixed cryosections from brains of Aldh1l1-eGFP mice that had undergone sham surgeries (A, E), MCAO (B–D, F–H), saline injection (I, M), or LPS injection (J–L, N–P). eGFP, in green, is expressed by and exclusively marks astrocytes. A–D, I–L, Reactive astrocytes, identified by GFAP immunostaining, in red, are present in the MCAO lesion penumbra (A–D) and cortex from LPS-treated mice (I–L) 1 d after injury and persist for over 1 week. J, K, Arrowheads indicate patches of reactive astrocytes in the cortex of LPS-treated mice. E–H, M–P, Activated microglia, identified by increased IBA1 immunoreactivity and process thickening, are evident over the same time course. eGFP expression in astrocytes is reduced in MCAO lesion core astrocytes (D, stars). Intense IBA1 expression in amoeboid cells in the MCAO lesion suggests peripheral macrophage infiltration into the core (H, stars). Scale bars: A–C, E–G, I–K, M–O, 50 μm; D, H, L, P, 200 μm. Q–T, Quantification of immunofluorescence signal was done using individual sections from control and injured brains. Q, Quantification of GFAP in brain sections (n = 4 for sham and 1 d, n = 5 for 7 d) shows the increase in reactive astrogliosis in the first week after MCAO-induced injury. R, Quantification of Iba1 (n = 4) in brain sections shows the increase in activated microglia in the first week after MCAO-induced injury. S, Quantification of GFAP in brain sections (n = 12 for saline, n = 13 for 1 d, and n = 4 for 7 d) shows the increase in reactive astrogliosis during LPS-induced neuroinflammation. T, Quantification of IBA1 in brain sections (n = 21 for saline, n = 22 for 1 d, and n = 9 for 7 d) shows the fold increase in activated microglia during LPS-induced neuroinflammation, with error bars representing SEM. *p < 0.05; **p < 0.01 for each injured time point relative to control. p = 0.055 for 7 d MCAO versus sham GFAP because of the high level of variance in response between animals.
Figure 2.
Figure 2.
FACS isolation of GFP-positive cells from brain suspensions made from healthy and injured Aldh1l1-eGFP mice yields pure populations of astrocytes. A–D, FACS plots show the composition of starting single-cell suspensions (A, B) and final astrocyte populations (C, D). GFP fluorescence, which is astrocyte specific, is shown on the x-axis, and PI, which is taken up by dead cells, is shown on the y-axis. A, B, eGFP+ astrocytes are 15–25% of the starting cell population from healthy (A) and injured (B) brain tissues. C, D, Double sorting of cell suspensions for live eGFP+ cells yields 98.8 ± 1.1% pure final populations of astrocytes. Bar graphs comparing probe set expression levels between astrocytes and other brain cell types confirm low levels of contamination in the isolated astrocyte populations. E–H, Isolated cell populations express markers for astrocytes (E) but not markers for microglia (F), neurons (G), and oligodendrocytes (H). Neuron and oligodendrocyte .cel files from Cahoy et al. (2008) were renormalized with the astrocyte and microglia .cel files from this study to make the comparison.
Figure 3.
Figure 3.
The isolated astrocytes express the classical markers of reactive astrocytes. A, Relative expression of reactive astrocyte genes in the GeneChip profiles from astrocytes isolated from healthy and injured brains is graphed over the course of 1 week. By 1 d after injury, GFAP and vimentin (Vim) are induced to similar degrees between MCAO and LPS reactive astrocytes. Nestin (Nes) is induced in MCAO reactive astrocytes but not LPS reactive astrocytes. GFAP and vimentin expression remains elevated over the course of 1 week after injury. In contrast, nestin expression is transient, decreasing to baseline levels by day 7 after injury. Error bars represent SEM. B–Q, Immunofluorescence for reactive astrocyte markers was performed on 10 μm fixed cryosections from the brains of Aldh1l1-eGFP mice that had undergone control surgeries (B, F), MCAO (C–E, G–I), saline injection (J, N), or LPS injection (K–M, O–Q). eGFP is expressed in and marks astrocytes. B, J, F, N, Reactive astrocyte markers are minimally expressed (vimentin; B, J) or not expressed (nestin; F, N) in healthy tissue. D, E, L, M, Vimentin expression is seen in astrocytes of the MCAO lesion penumbra strongly at 7 d (D, E) after injury and in astrocytes of the LPS-treated cortex after 7 d (L, M). H, I, MCAO penumbra astrocytes express nestin 7 d after injury. White stars indicate MCAO core regions in which astrocytes have lost GFP expression. O–Q, Nestin is not expressed in the LPS-treated cortex. Scale bars: B–D, F–H, J–L, N–P, 50 μm; E, I, M, Q, 200 μm.
Figure 4.
Figure 4.
GeneChip analysis of reactive astrocyte populations suggests new markers of reactive astrocytes. A, B, The relative expression, on a log2 scale, of all probe sets from the Affymetrix GeneChip Mouse Genome 430 2.0 arrays is represented on scatter plots. Expression by astrocytes from LPS-injected animals was compared with that by astrocytes from saline-injected animals (A), and expression by astrocytes from animals that had undergone MCAO was compared with that by astrocytes from animals that had undergone sham surgeries (B). Reactive astrocyte populations on the y-axis are compared with quiescent astrocyte populations on the x-axis. Each dot represents a probe set. Probe sets that are induced in LPS and MCAO reactive astrocytes are represented by red dots; probe sets that are repressed in LPS and MCAO reactive astrocytes are represented by blue dots. C, A heat map was generated by hierarchical clustering using the 263 genes whose expression is significantly induced more than fourfold at 1 d after injury. The dendrogram of the quiescent and reactive astrocyte replicates is represented in Euclidean distance. The relative expression of each probe set is indicated by color intensity, where blue indicates lower expression and red indicates higher expression. D–T, In situ hybridization with probes for two identified reactive astrocyte markers was done on fresh frozen coronal brain sections from healthy (D–G, zoom in H–L) and injured (M–P, zoom in Q–T) mice. Control sections from saline-injected and sham-operated mice do not have expression of either Lcn2 (H and I are zoom of boxes in D and E) or Serpina3n (K and L are zoom of boxes in F and G). Lcn2 is expressed in astrocytes throughout the cortex 1 d after LPS injection (Q is zoom of box in M) and in the astrocytes of the lesion penumbra 1 d after MCAO (R is zoom of box in N). Serpina3n in expressed in astrocytes 1 d after LPS injection (S is the zoom of box in O) or MCAO (T is the zoom of box in P). Red arrowheads indicate cells with astrocyte stellate morphology (Q–T). Scale bars: D–G, M–P, 1000 μm; H–L, Q–T, 50 μm.
Figure 5.
Figure 5.
Expression of genes induced in reactive astrocytes over time. A, The top 317 genes significantly upregulated in MCAO reactive astrocytes over 7 d were clustered using the k-means method with the standard Pearson correlation coefficient. Each line represents the relative expression of one gene at time points sham, 1 d, 3 d, and 7 d after MCAO. Genes are grouped into six patterns of expression, containing 14–135 members, that are represented in graphs 1–6. B, Diverse genes in group 3 are strongly induced at 1 d and are rapidly downregulated to near-quiescent levels by 7 d. Lcn2 is downregulated to near-baseline levels. Serpina3n expression remains elevated at 7 d. C, Expression of a subset of chemokines (CXCL1, CXCL2, and CXCL10) remains elevated over the course of 1 week (group 5 expression pattern). In contrast, macrophage chemokine CCL2 follows a group 3 expression pattern in which expression is rapidly moderated. D, In situ hybridization on coronal brain sections from healthy and injured mice confirms the time course indicated by the GeneChip expression profiles. Rows 1 (MCAO) and 2 (LPS), Lcn2 is upregulated by 1 d after injury but is rapidly downregulated; rows 3 (MCAO) and 4 (LPS), Serpina3n is upregulated by 1 d after injury and is downregulated, but remains elevated, 7 d after injury. Scale bar, 100 μm.
Figure 6.
Figure 6.
Reactive astrocytes show a delayed and transient upregulation of cell-cycle genes, suggesting modest proliferation after injury. The relative expression of cell-cycle genes in reactive astrocytes over time was represented on a line graph. The expression of early-phase cyclin D is upregulated at 1 d after MCAO. The expression of late-phase cell-cycle genes and proliferation marker ki67 is upregulated at 3 d. All cell-cycle gene expression is returning toward baseline by 7 d after MCAO.
Figure 7.
Figure 7.
LPS and MCAO reactive astrocytes have overlapping but distinct sets of induced genes. A, The Venn diagram shows the distribution of the 263 genes significantly upregulated more than fourfold in the LPS and/or MCAO reactive astrocytes. There are 113 genes more than fourfold upregulated in LPS reactive astrocytes. There are 205 genes more than fourfold upregulated in MCAO reactive astrocytes. Fifty-six genes are common to both types of reactive astrocytes. B, C, Pie charts show the Gene Ontology categorization of the MCAO (B) and LPS (C) reactive gene sets. Extracellular matrix modification and immune response are prominent classes.
Figure 8.
Figure 8.
MCAO reactive astrocytes and LPS reactive astrocytes express differing levels of extracellular binding/adhesion/modification genes. A, A heat map was generated by hierarchical clustering using extracellular binding/adhesion/modification genes whose expression was significantly induced more than fourfold at 1 d after either injury. The dendrogram of the quiescent and reactive astrocyte replicates is represented in Euclidean distance. Relative expression is shown where blue indicates lower expression and red indicates higher expression. LPS reactive astrocytes and MCAO reactive astrocytes modify the extracellular space in distinct ways. B, The bar graph shows the fold induction of genes within the class in MCAO reactive astrocytes (blue) and LPS reactive astrocytes (red). All replicates within a class were averaged to obtain the fold induction. Although there are similarities between MCAO and LPS reactive astrocytes, there are extensive differences in gene expression induction patterns between them.
Figure 9.
Figure 9.
MCAO reactive astrocytes and LPS reactive astrocytes express differing levels of cytokine signaling genes. A, The bar graph shows fold induction of cytokine signaling genes in MCAO reactive astrocytes (blue) and LPS reactive astrocytes (red). All replicates within a class were averaged to obtain the fold induction. Pro-inflammatory cytokines CXCL1, CXCL2, and CXLC10 are similarly induced in both MCAO and LPS reactive astrocytes. The neurotrophic cytokines LIF, IL6, and CLCF1 and macrophage chemokine CCL2 are more strongly induced in MCAO reactive astrocytes. B, A heat map was generated by hierarchical clustering of resting and reactive astrocyte populations using cytokine signaling genes whose expression is significantly induced more than fourfold at 1 d after either injury. The dendrogram of astrocyte replicates is represented in Euclidean distance. The heat map indicates relative expression where blue indicates lower expression and red indicates higher expression. Variability in reactive astrocyte response to injury occurs even within an injury model. Two replicates of LPS reactive astrocytes cluster more closely with the MCAO reactive astrocytes, and one replicate has an expression pattern that places it within the quiescent astrocytes cluster.
Figure 10.
Figure 10.
LPS reactive astrocytes more highly induce the antigen presentation and complement pathways. A, The fold induction of antigen presentation pathway genes in MCAO reactive astrocytes (blue) and LPS reactive astrocytes (red) is shown. All replicates within a class were averaged to obtain the fold induction. Antigen presentation pathway genes are induced 2- to 30-fold in LPS reactive astrocytes but only 10% to threefold in MCAO reactive astrocytes. B, A heat map was generated by hierarchical clustering using antigen presentation pathway genes. The distance on the dendrogram between resting and reactive astrocyte population replicates is represented in Euclidean distance. The heat map indicates relative expression where blue indicates lower expression and red indicates higher expression. LPS reactive astrocytes cluster separate from other astrocyte populations. C, The fold induction of complement pathway genes in MCAO reactive astrocytes (blue) and LPS reactive astrocytes (red) is compared. Complement genes are induced 4.5- to 34-fold in LPS reactive astrocytes but only 2.4- to 6.8-fold in MCAO reactive astrocytes. D, Four of the five LPS reactive astrocyte replicate clusters separate from other astrocyte populations on the basis of their complement pathway gene expression. MCAO reactive astrocytes, one LPS replicate, and one quiescent replicate show an intermediate induction of complement pathway expression.
Figure 11.
Figure 11.
ISH confirms differences in expression of reactive astrocyte genes between injuries. In situ hybridization with potential markers of LPS and MCAO reactive astrocytes was performed on coronal brain sections from healthy (A, D, G, J, M) and injured (B, C, E, F, H, I, K, L, N, O) mice. A, D, H2-D1 (A) is expressed in sparse cells, and Serping1 (D) is not expressed in cortex of saline-injected mice. B, E, One day after MCAO, increased numbers of cells express H2-D1 (B) and very sparse cells express Serping1 (E). C, F, One day after LPS, a high density of cells, including some astrocytes, express H2-D1 (C) and Serping1 (F). G, J, M, S1Pr3 (G), Ptx3 (J), and tweak receptor (M) are not expressed in the healthy cortex from sham mice. H, I, K, L, N, O, S1PR3 (H), Ptx3 (K), and tweak receptor (N) are highly expressed in MCAO penumbral astrocytes 1 d after MCAO but are below detectable limits in the cortex of LPS-injected mice (I, L, A,). Scale bar, 100 μm.
Figure 12.
Figure 12.
Reactive astrocytes in the injured brain are heterogeneous. Double-fluorescent ISH with identified markers Lcn2 and Serpina3n was performed on 10 μm fresh frozen cryosections. A–H, Astrocytes are labeled for Glast in green. Reactive astrocyte markers, Lcn2 (A–D) or serpina3n (E–H), are labeled in red. Strongly reactive astrocytes (B, D, F, H, red arrows) can be seen adjacent to relatively quiescent astrocytes (B, D, F, H, red arrowheads). Expression of Lcn2 is also localized in endothelial cells (H, white arrowhead). I–L, The background signal from the FITC-tyramide and Cy3-tyramide amplifications can be seen. Scale bar, 50 μm.
Figure 13.
Figure 13.
McCarthy-de Vellis astrocytes express elevated levels of reactive gliosis genes. A, The Venn diagram shows the distribution of genes significantly induced more than fourfold in LPS and MCAO reactive astrocytes and significantly expressed more than fourfold more in MD-astrocytes relative to astrocytes in vivo. More than 50% of astrocyte reactive gliosis genes are elevated in MD-astrocytes relative to astrocytes in vivo. B, The dendrogram represented in Euclidean distance was generated by hierarchical clustering of the quiescent, reactive, and MD-astrocyte expression profiles using the 263 more than fourfold induced reactive astrocyte genes. MD-astrocytes cluster most strongly with MCAO reactive astrocytes and away from all three groups of quiescent astrocytes. C, Hierarchical clustering represented in Euclidean distance of the quiescent, reactive, and MD-astrocyte expression profiles using class subsets of genes. Using the cytokine signaling genes, ECM binding/adhesion genes, and IL6 signaling pathway, MD-astrocytes cluster most closely with MCAO reactive astrocytes. Using the complement pathway and interferon response genes, MD-astrocytes cluster most closely with the LPS reactive astrocytes. Using transporter/channel genes, peptidase inhibitors, and acute phase signaling, MD-astrocytes cluster with both subtypes of reactive astrocytes. Using the antigen presentation pathway, MD-astrocytes cluster with quiescent astrocytes.

Similar articles

Cited by

References

    1. Adelson JD, Barreto GE, Xu L, Kim T, Brott BK, Ouyang YB, Naserke T, Djurisic M, Xiong X, Shatz CJ, Giffard RG. Neuroprotection from stroke in the absence of MHCI or PirB. Neuron. 2012;73:1100–1107. - PMC - PubMed
    1. Alilain WJ, Horn KP, Hu H, Dick TE, Silver J. Functional regeneration of respiratory pathways after spinal cord injury. Nature. 2011;475:196–200. - PMC - PubMed
    1. Anthony TE, Heintz N. The folate metabolic enzyme ALDH1L1 is restricted to the midline of the early CNS, suggesting a role in human neural tube defects. J Comp Neurol. 2007;500:368–383. - PubMed
    1. Banks WA, Robinson SM. Minimal penetration of lipopolysaccharide across the murine blood-brain barrier. Brain Behav Immun. 2010;24:102–109. - PMC - PubMed
    1. Barreto GE, Sun X, Xu L, Giffard RG. Astrocyte proliferation following stroke in the mouse depends on distance from the infarct. PLoS One. 2011;6:e27881. - PMC - PubMed

Publication types