. 2012 Jul;227(3):286-97.
doi: 10.1002/path.4047.

From sequence to molecular pathology, and a mechanism driving the neuroendocrine phenotype in prostate cancer

Affiliations

From sequence to molecular pathology, and a mechanism driving the neuroendocrine phenotype in prostate cancer

Anna V Lapuk et al. J Pathol. 2012 Jul.

Abstract

The current paradigm of cancer care relies on predictive nomograms which integrate detailed histopathology with clinical data. However, when predictions fail, the consequences for patients are often catastrophic, especially in prostate cancer where nomograms influence the decision to therapeutically intervene. We hypothesized that the high dimensional data afforded by massively parallel sequencing (MPS) is not only capable of providing biological insights, but may aid molecular pathology of prostate tumours. We assembled a cohort of six patients with high-risk disease, and performed deep RNA and shallow DNA sequencing in primary tumours and matched metastases where available. Our analysis identified copy number abnormalities, accurately profiled gene expression levels, and detected both differential splicing and expressed fusion genes. We revealed occult and potentially dormant metastases, unambiguously supporting the patients' clinical history, and implicated the REST transcriptional complex in the development of neuroendocrine prostate cancer, validating this finding in a large independent cohort. We massively expand on the number of novel fusion genes described in prostate cancer; provide fresh evidence for the growing link between fusion gene aetiology and gene expression profiles; and show the utility of fusion genes for molecular pathology. Finally, we identified chromothripsis in a patient with chronic prostatitis. Our results provide a strong foundation for further development of MPS-based molecular pathology.


Figures

Figure 1
Figure 1
Summary of the prostate tumour cohort. Sample origin indicated in the top panel with histopathology status (red malignant; blue = benign). The depth of RNA-Seq is presented as the sum of read lengths mapped to the human genome (Gb = gigabases). The tumour cellularity was estimated by histopathology. PCa = prostate adenocarcinoma; ? = unknown primary origin; hPCa = dual signature adenocarcinoma–neuroendocrine prostate cancer; NEPCa = neuroendocrine prostate cancer (small cell carcinoma of the prostate); Dx = diagnosis; 1° = primary tumour; LN = lymph node; U = urethral metastasis; Pn = penile metastasis; X = xenograft derived from urethral metastasis. Therapy prior to sample collection: NHT = neoadjuvant hormone therapy; IAS = intermittent androgen suppression (four cycles); CHT = continuous hormone therapy. CPRC = castrate = resistant prostate cancer. *The patient did not reach nadir post-surgery (PSA did not drop to 0.2 ng/dl). # Negative pathological surgical margins.
Figure 2
Figure 2
Alternative splicing in prostate tumours. (a) RT-PCR validation of alternatively spliced genes detected in prostate tumours and cell lines. Primers designed for the flanking constitutive exons with expected PCR product sizes are shown in the cartoons below each gel electrophoresis image. RNA-Seq-based splicing data for inclusion isoform (corresponding to the upper PCR band) are shown below each gel as splicing index bar charts for corresponding exons/junctions. (b) Possible functional consequences of alternative splicing. Protein domains (Pfam [61]) are shown for three genes, where alternatively spliced regions fall within functional domains. Alternatively spliced region of a gene is shown below the protein domain structure (blue = alternative exons; grey = constitutive exons) and its portion coding for functional domains are indicated with dashed lines. (c) Heat map of the splicing index data for exons/junctions within 12 genes showing difference in splicing in neuroendocrine samples versus primary adenocarcinoma tumours. Genes labelled on the right with magenta are involved in nervous system development [–60]. Exon/junction IDs are shown on the right from gene symbols. (d) Alternative splicing of the PHF21A gene. The expression of the mutually exclusive exons of PHF21A by RNA-Seq is shown as a bar chart. PCR validation gel is shown underneath.
Figure 3
Figure 3
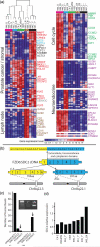
RNA-Seq-derived molecular pathology of prostate tumours and detection of a sub-clinical metastasis. (a) Two-way unsupervised hierarchical clustering of the gene expression profiles of the prostate cancer cohort using the top 1000 genes differentially expressed among tumours. Sample clusters colour bar is shown underneath sample labels. Representative gene clusters with cell type or tissue-specific signatures are shown (for full clusters see Supporting information, Supplementary Figure 5). Red = prostate-specific/androgen-responsive genes; blue = basal cell markers; green = luminal epithelial cell markers; magenta = neuroendocrine cell markers; black = stromal cell markers; brown = lymph node markers. (b) Schematic representation of the FZD6:SDC2 fusion gene showing maintenance of the SDC2 reading frame and protein domains. (c) RNA-Seq-derived expression level of the fusion genes detected in the primary tumour and matched lymph node sample from patient 945. RT-PCR validation gel image showing the enrichment of FZD6:SDC2 is also provided. (d) Expression of SDC2 (log2) normalized to prostate-specific genes to account for tumour cellularity, demonstrating overexpression of SDC2 in the LN of patient 945.
Figure 4
Figure 4
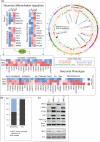
The acquisition and maintenance of a neuroendocrine phenotype. (a) The bottom panel shows the neuronal phenotype identified in the tumours of patients 946 and 963. For patient 946, we used the mean expression from all three samples. Stars within the heat map illustrate statistically different expression from other adenocarcinoma PCa samples. Red circles by the gene name indicate an experimentally validated REST binding site within the gene loci. Rec–receptor. The top-left panel demonstrates a panel of regulatory genes up-regulated in the same tumour samples which we hypothesize to act synergistically to maintain expression of the neuronal phenotype. The top-right panel is a Circos plot [62] of the 946_Pn sample demonstrating the CN and fusion gene profile exhibited by the tumours of patient 946. Chromosomes are arranged circularly end-to-end with each chromosome's cytobands marked in the outer ring. The inner ring displays copy number data inferred from genome sequencing, with red indicating gains and green indicating losses. Within the circle, genomic rearrangements are shown as arcs with the resultant validated fusion transcript annotated. Function of genes involved in fusions are indicated by colour and provided in the key. (b) Recurrence of the REST down-regulation and the neuronal signature up-regulation from a in the prostate cancer cohort published by Taylor et al [9] showing 50% frequency in the NED/NEPCa subset of tumours (n = 16) versus 3% in the PCa subset (n = 134). The NED/NEPCa subset was defined by overexpression of at least one of the neuroendocrine markers (CHGA, CHGB or SYP; Supporting information, Supplementary methods). (c) siRNA knockdown of REST in LNCaP cells. RT-PCR gel shows down-regulation of REST using two independent siRNA pools and concomitant up-regulation of neuronal signature genes as well as change in PHF21A splicing. An arrow indicates the isoform lacking the AT-hook binding domain. Sc = scrambled RNA control. Western blot using REST and vinculin antibodies is shown underneath RT-PCR, demonstrating significant down-regulation of REST protein upon siRNA transfection.
Figure 5
Figure 5
Chromothripsis, inflammatory response, and fusion genes in patient 890. The top panel indicates multiple putative genomic breakpoints between 2p and 9q resulting in validated fusion transcripts. The second panel demonstrates the top 50 uniquely expressed genes in the primary tumour of patient 890 compared with all other tumour samples, showing enrichment (small arrows) of genes linked to response to inflammation and apoptosis. *Pancreas-specific genes; **colon-specific genes. The third panel shows the fusion transcripts derived from genomic rearrangements between chromosomes 2 and 9, including triple gene fusions. The bottom panel provides genomic sequence-derived copy number profiles, indicating the lack of amplifications and the high number of focal deletions, a hallmark of chromothripsis [18,49].

References

    1. Siegel R, Naishadham D, Jemal A. Cancer statistics. Ca Cancer J Clin 2012. 2012;62:10–29. - PubMed
    1. Graefen M, Karakiewicz PI, Cagiannos I, et al. Validation study of the accuracy of a postoperative nomogram for recurrence after radical prostatectomy for localized prostate cancer. J Clin Oncol. 2002;20:951–956. - PubMed
    1. Graefen M, Karakiewicz PI, Cagiannos I, et al. International validation of a preoperative nomogram for prostate cancer recurrence after radical prostatectomy. J Clin Oncol. 2002;20:3206–3212. - PubMed
    1. Kattan MW, Eastham JA, Stapleton AM, et al. A preoperative nomogram for disease recurrence following radical prostatectomy for prostate cancer. J Natl Cancer Inst. 1998;90:766–771. - PubMed
    1. Kattan MW, Wheeler TM, Scardino PT. Postoperative nomogram for disease recurrence after radical prostatectomy for prostate cancer. J Clin Oncol. 1999;17:1499–1507. - PubMed

Publication types

MeSH terms

Substances