

doi: 10.1259/bjr/34786470.
Epub 2012 May 2.
Tendon and ligament imaging
Affiliations
- PMID: 22553301
- PMCID: PMC3495576
- DOI: 10.1259/bjr/34786470
Item in Clipboard
Tendon and ligament imaging
Br J Radiol.
2012 Aug.
Abstract
MRI and ultrasound are now widely used for the assessment of tendon and ligament abnormalities. Healthy tendons and ligaments contain high levels of collagen with a structured orientation, which gives rise to their characteristic normal imaging appearances as well as causing particular imaging artefacts. Changes to ligaments and tendons as a result of disease and injury can be demonstrated using both ultrasound and MRI. These have been validated against surgical and histological findings. Novel imaging techniques are being developed that may improve the ability of MRI and ultrasound to assess tendon and ligament disease.
Figures
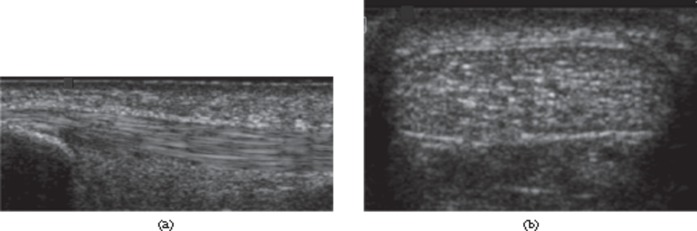
Ultrasound of the normal Achilles tendon. Longitudinal (a) and transverse (b) ultrasound images of distal tendon. The normal tendon appears echogenic with multiple, parallel echogenic lines reflecting the internal fibrillar structure.
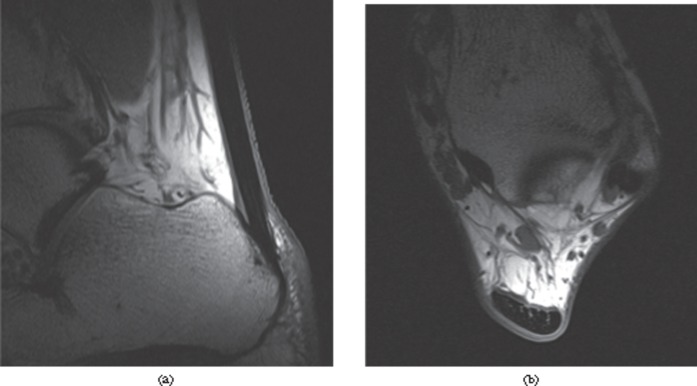
MRI of the normal Achilles tendon. T1 weighted images of a healthy Achilles tendon, (a) sagittal and (b) axial, just proximal to the calcaneum. The tendon appears with predominantly low signal intensity. Linear and punctuate high signal is seen within the tendon reflecting the complex hierarchical internal structure.
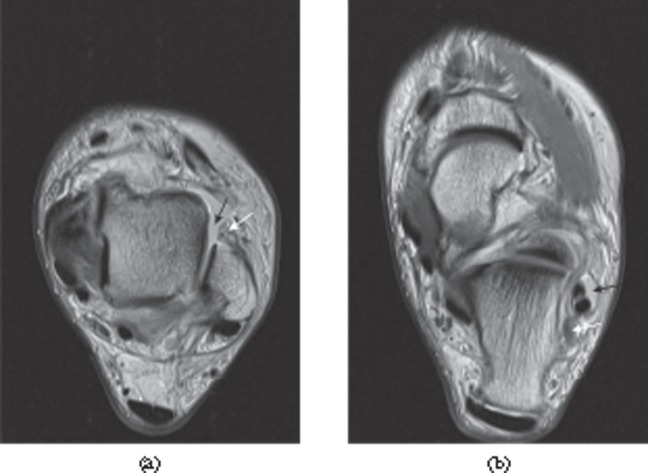
Magic angle artefact. Peroneus brevis tendon (arrow) appears with increased intensity on a T1 weighted image (a) as it approaches an angle of 55° to the external magnetic field, which is perpendicular to the plane of the image. The T2 weighted image (b), with its longer echo time, shows the tendon with normal, low signal intensity.
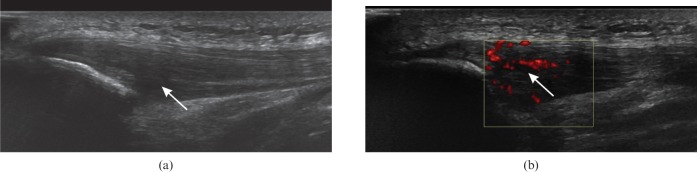
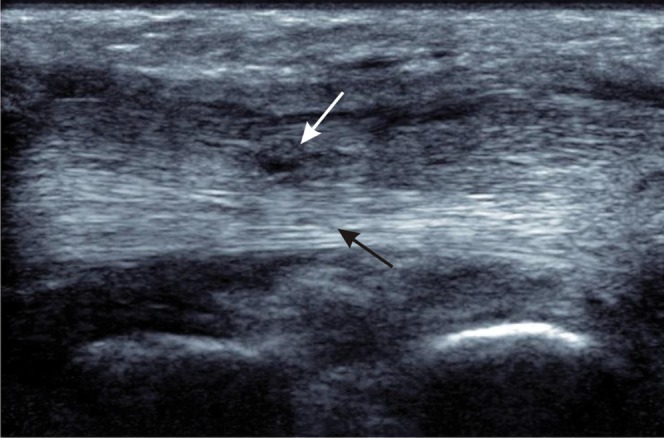
Patellar tendinosis. (a) Longitudinal ultrasound of the patellar tendon near the inferior pole of the patella shows hypoechoic thickening (arrow). (b) Power Doppler shows neovascularisation of the tendinopathic region (arrow).
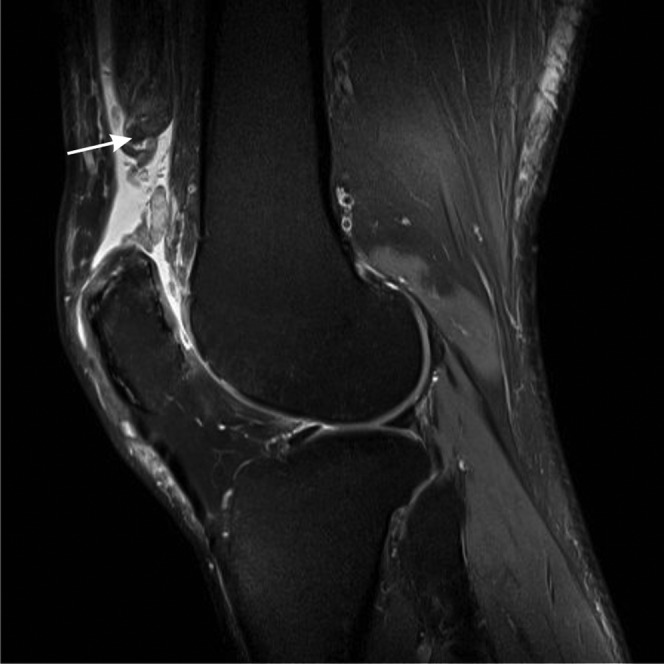
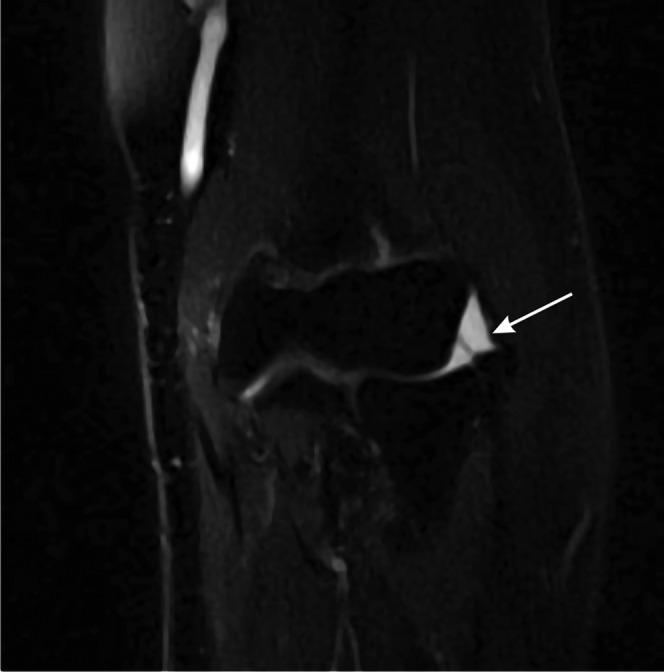
Quadriceps tendon rupture. Sagittal T2 weighted fat-suppressed image. The quadriceps tendon is discontinuous and is replaced by fluid. The tendon and proximal muscle are retracted (arrow).
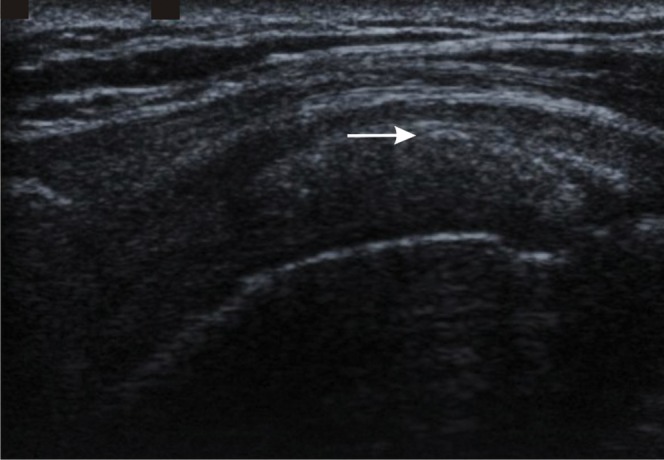
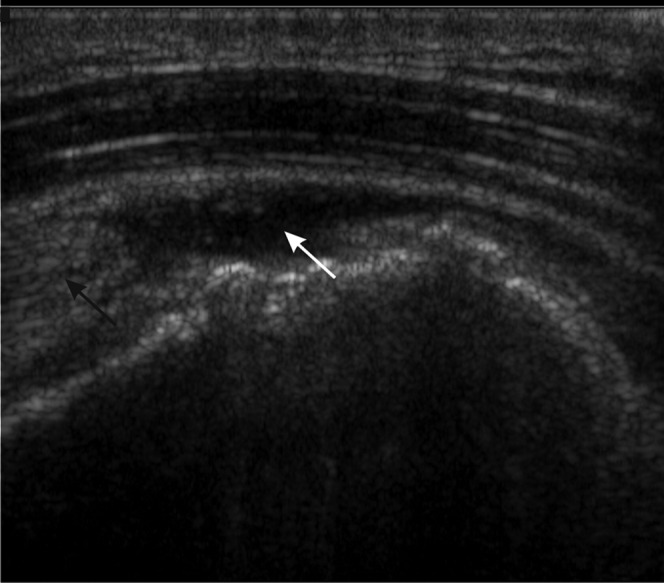
Rotator cuff calcification. Longitudinal ultrasound image of the supraspinatus tendon showing echogenic calcification within the tendon (arrow) without acoustic shadowing, a common feature of less mature tendon calcification.
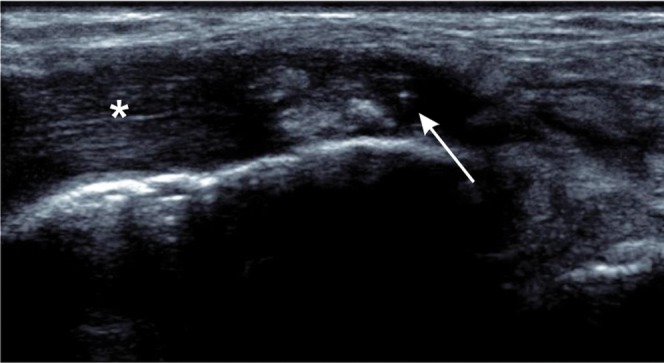
Full thickness tear of tibialis posterior. Longitudinal ultrasound shows fluid and debris within the tendon sheath (arrow) with tendinopathy of the adjacent tendon (asterisk).
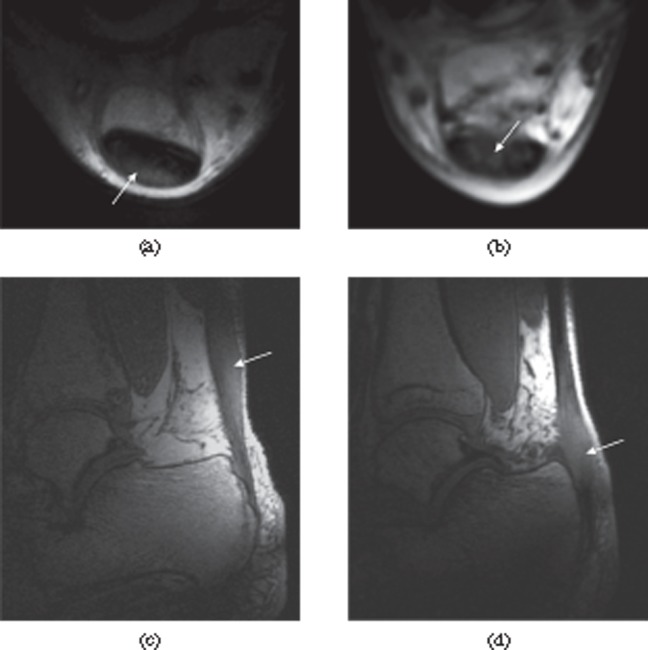
Mechanical and inflammatory Achilles tendon disease (arrows). Short echo time images of the Achilles tendon in mechanical tendinosis (a, c) and inflammatory tendinopathy (b, d). Axial sections show the posterior location of the tendinosis (a) and the anterior location of the inflammatory disease (b). Sagittal sections show tendinosis in the mid-portion of the tendon in mechanical disease (c). Inflammatory disease is typically more closely related to the enthesis (d).
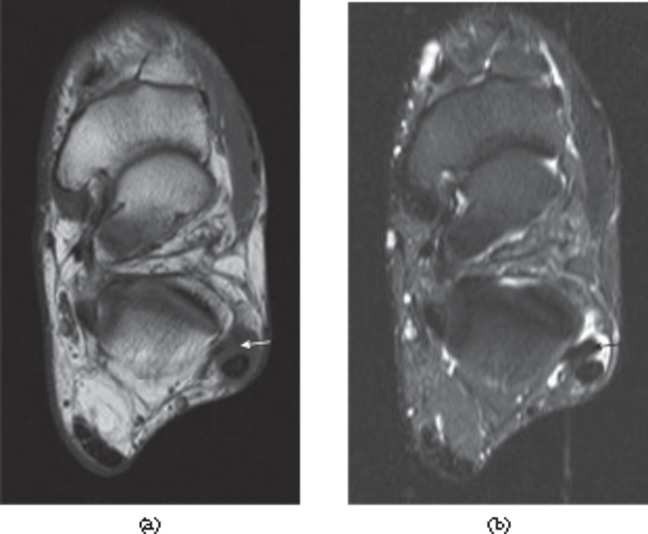
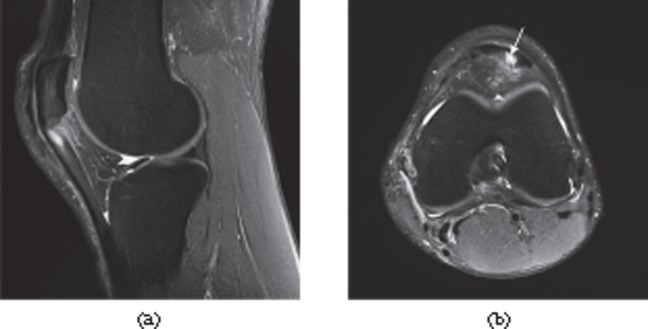
Tears of the lateral ligaments of the ankle. (a) Full thickness tear of the distal anterior talofibular ligament. There is a fluid-filled discontinuity distally (black arrow) with proximal retraction (white arrow). (b) Full thickness tear of the calcaneofibular ligament in the same patient. The ligament (white arrow) is of increased signal intensity on the proton density-weighted image and retracted posterior to the peroneal tendons. There is associated fluid in the peroneal tendon sheath (black arrow).
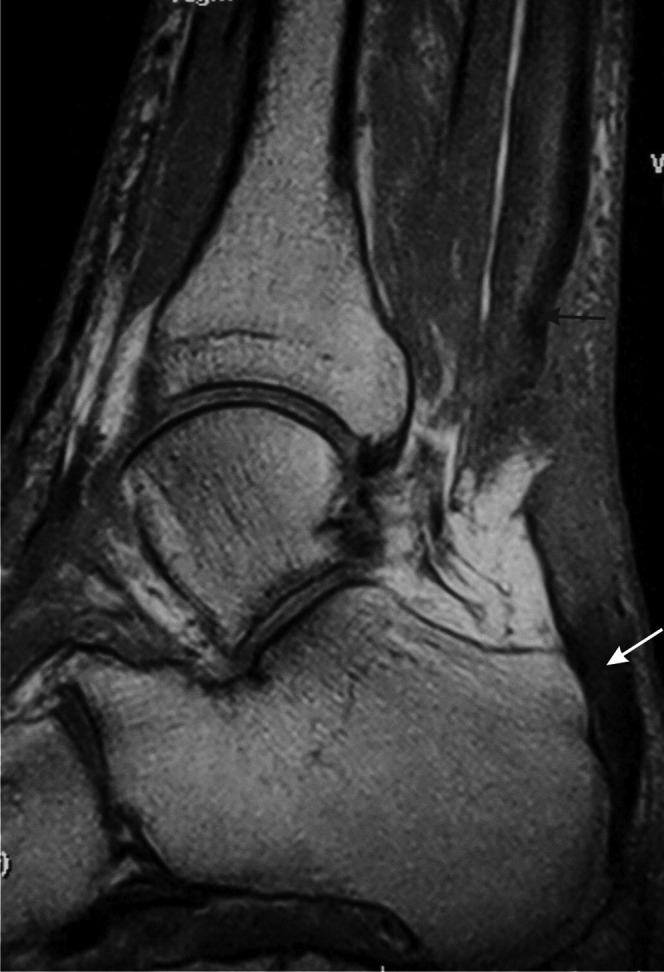
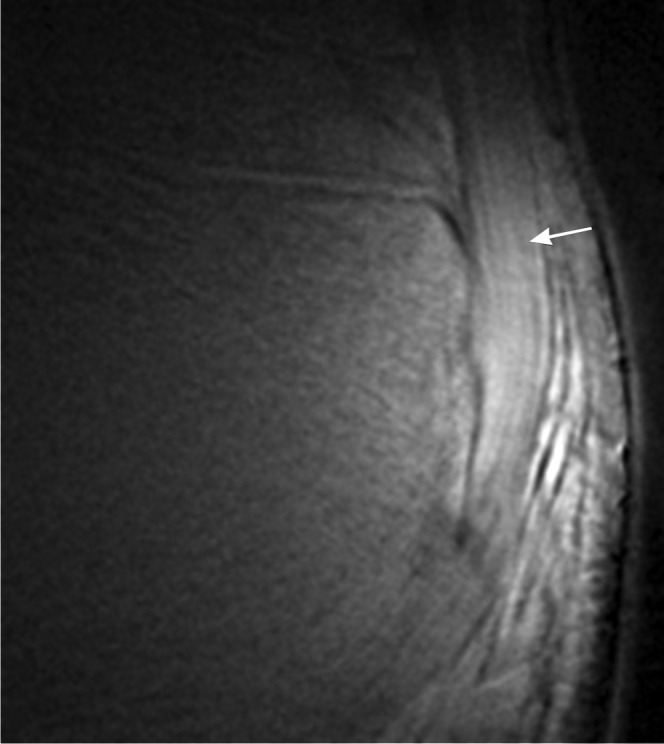
Full thickness tear of the Achilles tendon. T1 weighted sagittal MRI. There is discontinuity of the tendon with retraction of the proximal portion (black arrow). The distal tendon is tendinopathic and appears thickened and of increased signal intensity (white arrow).
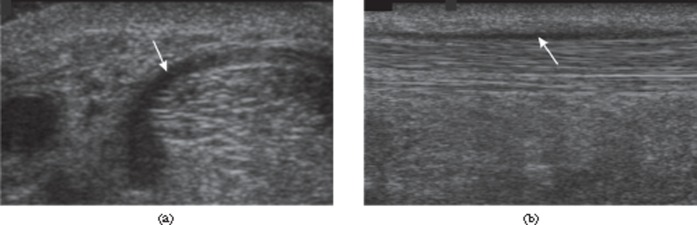
Paratenonitis. Transverse (a) and longitudinal (b) ultrasound images of the Achilles tendon showing thickened, hypoechoic paratenon (arrows) surrounding the tendon.
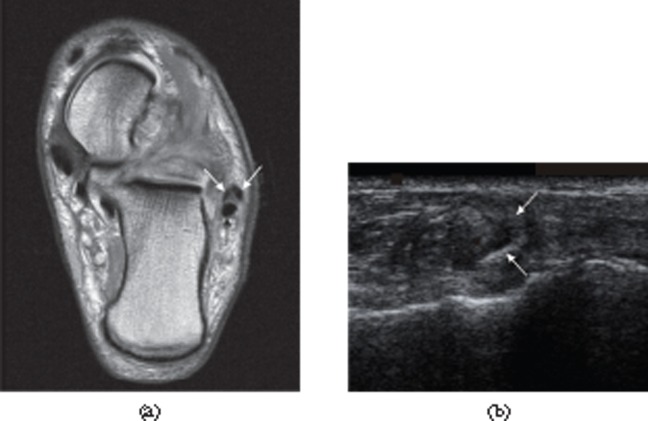
Peroneus brevis split. (a) Axial proton density-weighted MRI. (b) Ultrasound. The split components of the tendon of peroneus brevis (white arrows in both parts) extend around the peroneus longus tendon [black arrow in part (a)].
Partial thickness tear of the tibialis posterior tendon. Longitudinal ultrasound shows a normal fibrillar pattern of the intact, deep part of the tendon (black arrow) with partial tearing of superficial fibres where there is loss of the normal echogenic pattern and localised thinning of the tendon (white arrow).
Full thickness rotator cuff tear. Longitudinal ultrasound showing retraction of the supraspinatus tendon (black arrow) with anechoic fluid in the tear (white arrow).

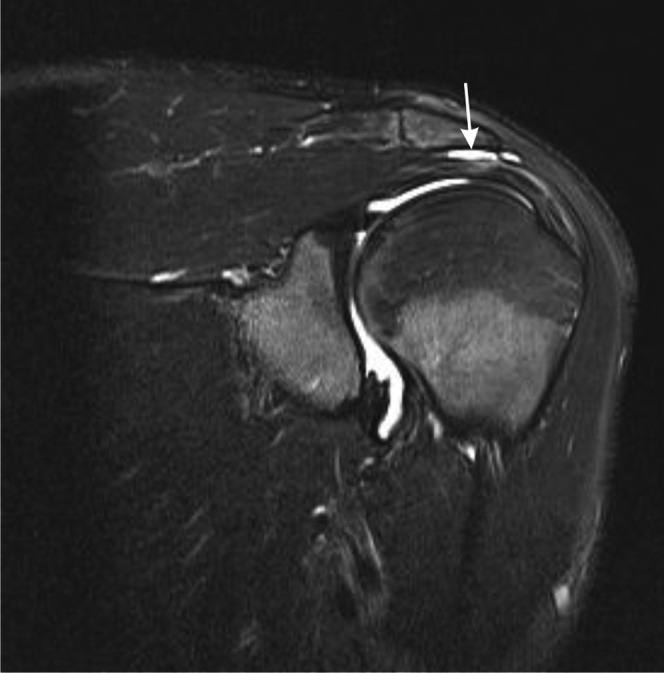
Full thickness tear of the rotator cuff of the shoulder. T2 weighted paracoronal image of the shoulder shows a full thickness tear with fluid filling the defect in the supraspinatus tendon near the insertion into the greater tuberosity (black arrow). More proximally, the tendon is tendinopathic with increased intensity and linear fluid signal intensity owing to partial tearing (white arrow).
Subacromial, subdeltoid bursitis. Sagittal T2 weighted fat-suppressed paracoronal image of the shoulder showing subacromial, subdeltoid bursitis (white arrow).
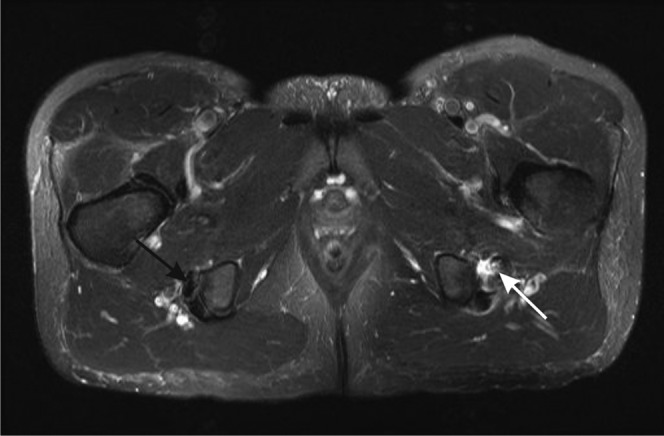
Proximal hamstring tendinopathy and partial tearing. Axial T2 weighted image of the proximal hamstrings. The right side shows the normal hypointense appearance of the tendons of semimembranosus (anterior, black arrow) and semitendinosus and biceps femoris (posterior) near their insertions into the ischial tuberosity. On the left, there is tendinosis of the semimembranosus tendon, which is thickened and of increased intensity, with partial tearing shown as fluid signal crossing part of the tendon (white arrow). There is also fluid adjacent to the tendon.
Patellar tendinosis. Proton density-weighted fat-suppressed (a) sagittal and (b) axial images of the knee. There is proximal hyperintensity and thickening of the patellar tendon. Axial image shows tendinopathy in the typical central/medial region of the tendon (arrow).
Lateral epicondylitis. T2 weighted MRI of the elbow showing a partial thickness tear of the common extensor tendon (arrow).
Ultrashort echo time MRI. Ultrashort echo time subtraction image (ultrashort echo time–gradient echo) showing the fibrillar structure of the Achilles tendon near the enthesis (arrow).
Ultrashort echo time MRI. Contrast-enhanced ultrashort echo time subtraction images (post-contrast–pre-contrast) of the Achilles tendon. (a) Healthy volunteer showing little enhancement. (b) Patient with psoriatic arthritis showing thickening and enhancement of the tendon (arrow).
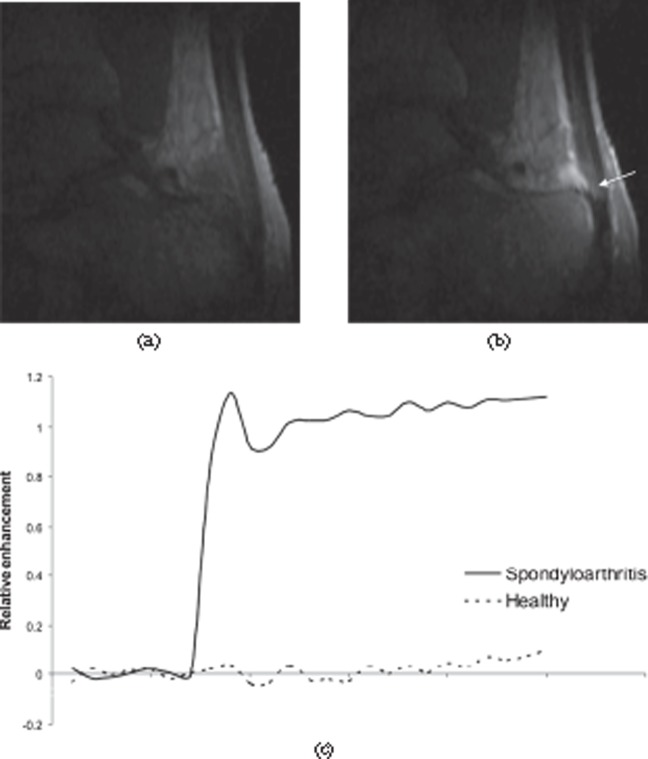
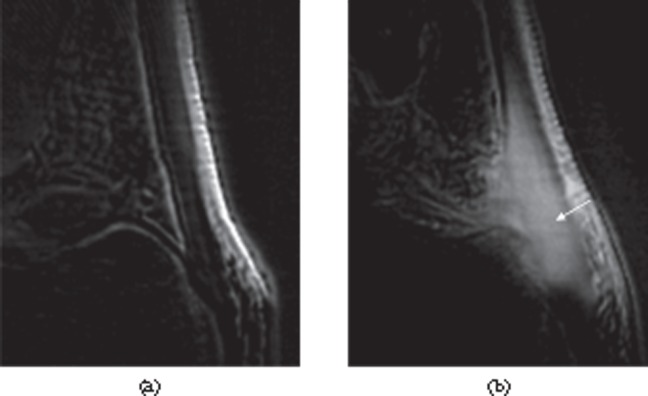
Dynamic contrast-enhanced MRI of the Achilles tendon. (a) Pre-contrast and (b) post-contrast sections from a three-dimensional dynamic series showing enhancement of the tendon (arrow), retrocalcaneal bursa and adjacent bone in a patient with spondyloarthritis. (c) Enhancement curves comparing a normal Achilles tendon (dashed line) with a tendon from a spondyloarthritis patient (solid line). The tendon from the patient shows much greater, rapid enhancement.
References
-
- Pierre-Jerome C, Moncayo V, Terk MR. MRI of the Achilles tendon: a comprehensive review of the anatomy, biomechanics, and imaging of overuse tendinopathies. Acta Radiol 2010;51:438–54 - PubMed
-
- Rich A, Crick FH. The structure of collagen. Nature 1955;176:915–16 - PubMed
-
- Rich A, Crick FH. The molecular structure of collagen. J Mol Biol 1961;3:483–506 - PubMed
-
- Ramachandran GN, Chandrasekharan R. Interchain hydrogen bonds via bound water molecules in the collagen triple helix. Biopolymers 1968;6:1649–58 - PubMed
-
- Fullerton GD, Rahal A. Collagen structure: the molecular source of the tendon magic angle effect. J Magn Reson Imaging 2007;25:345–61 - PubMed
Publication types
MeSH terms
Grants and funding
LinkOut - more resources
Full Text Sources
Other Literature Sources
Medical
