

Extracellular matrix protein tenascin-C is required in the bone marrow microenvironment primed for hematopoietic regeneration
- PMID: 22553313
- PMCID: PMC3418770
- DOI: 10.1182/blood-2011-11-393645
Extracellular matrix protein tenascin-C is required in the bone marrow microenvironment primed for hematopoietic regeneration
Abstract
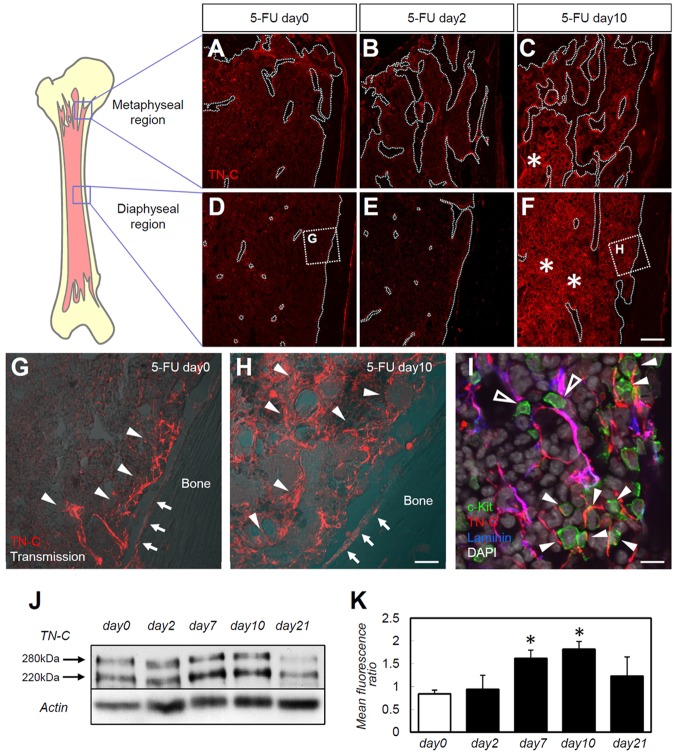
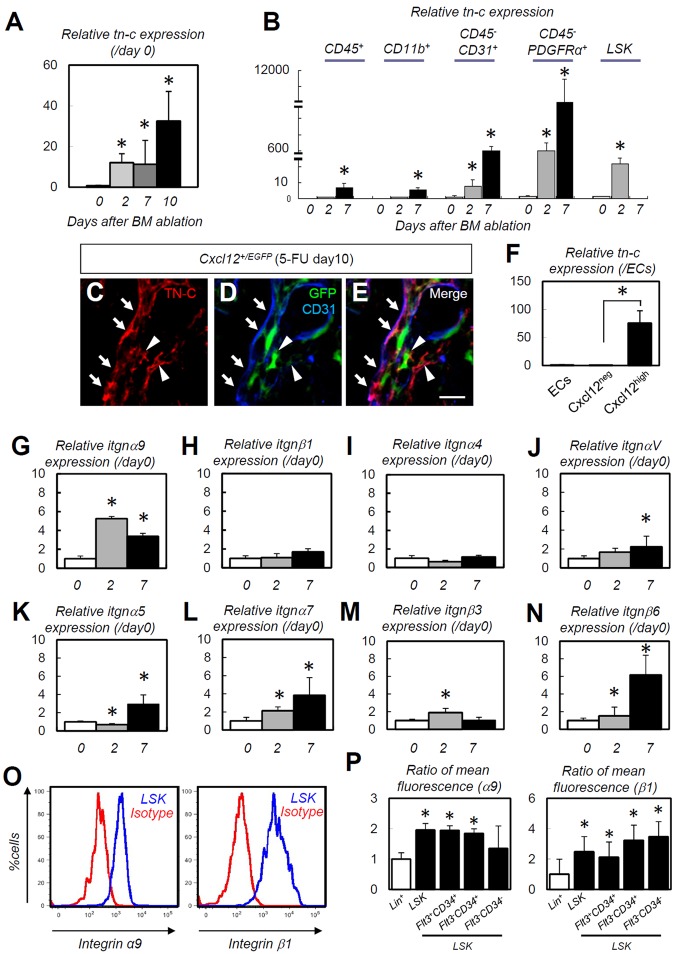
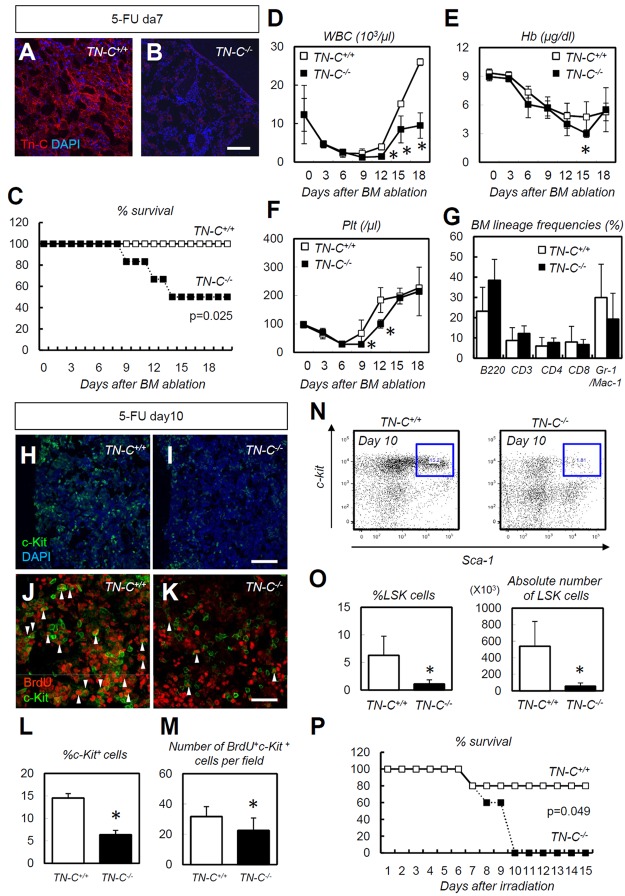
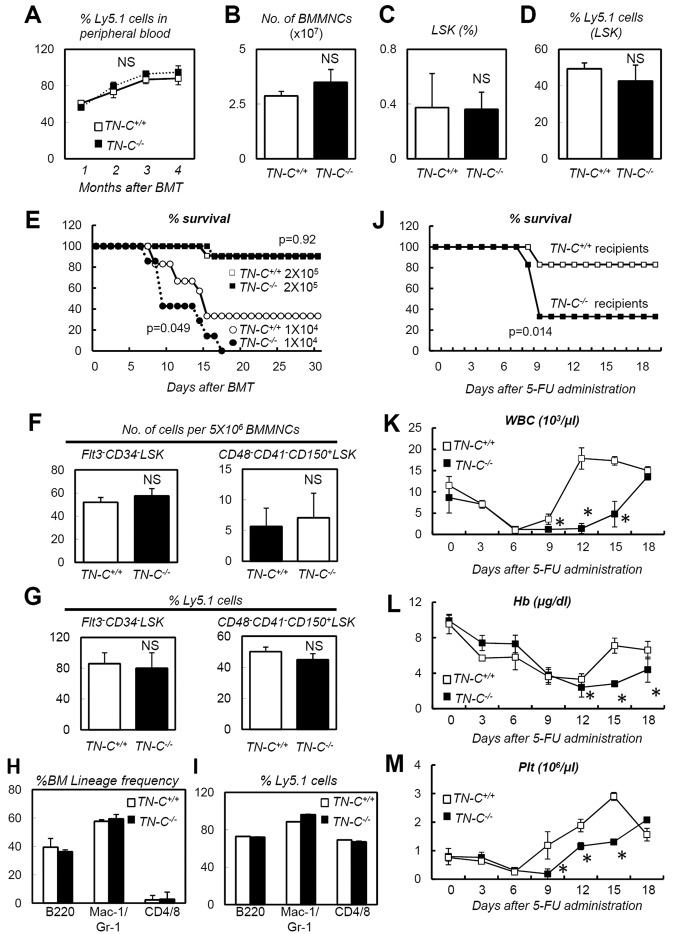
The BM microenvironment is required for the maintenance, proliferation, and mobilization of hematopoietic stem and progenitor cells (HSPCs), both during steady-state conditions and hematopoietic recovery after myeloablation. The ECM meshwork has long been recognized as a major anatomical component of the BM microenvironment; however, the molecular signatures and functions of the ECM to support HSPCs are poorly understood. Of the many ECM proteins, the expression of tenascin-C (TN-C) was found to be dramatically up-regulated during hematopoietic recovery after myeloablation. The TN-C gene was predominantly expressed in stromal cells and endothelial cells, known as BM niche cells, supporting the function of HSPCs. Mice lacking TN-C (TN-C(-/-)) mice showed normal steady-state hematopoiesis; however, they failed to reconstitute hematopoiesis after BM ablation and showed high lethality. The capacity to support transplanted wild-type hematopoietic cells to regenerate hematopoiesis was reduced in TN-C(-/-) recipient mice. In vitro culture on a TN-C substratum promoted the proliferation of HSPCs in an integrin α9-dependent manner and up-regulated the expression of the cyclins (cyclinD1 and cyclinE1) and down-regulated the expression of the cyclin-dependent kinase inhibitors (p57(Kip2), p21(Cip1), p16(Ink4a)). These results identify TN-C as a critical component of the BM microenvironment that is required for hematopoietic regeneration.
Figures


Similar articles
-
Distinct effects of chondroitin sulfate on hematopoietic cells and the stromal microenvironment in bone marrow hematopoiesis.Exp Hematol. 2021 Apr;96:52-62.e5. doi: 10.1016/j.exphem.2021.02.003. Epub 2021 Feb 12. Exp Hematol. 2021. PMID: 33582241
-
Suppression of hematopoietic activity in tenascin-C-deficient mice.Blood. 1998 Jun 1;91(11):4074-83. Blood. 1998. PMID: 9596652
-
Donor hematopoietic stem cells confer long-term marrow reconstitution by self-renewal divisions exceeding to that of host cells.PLoS One. 2012;7(12):e50693. doi: 10.1371/journal.pone.0050693. Epub 2012 Dec 5. PLoS One. 2012. PMID: 23227199 Free PMC article.
-
Complexity of bone marrow hematopoietic stem cell niche.Int J Hematol. 2017 Jul;106(1):45-54. doi: 10.1007/s12185-017-2262-9. Epub 2017 May 22. Int J Hematol. 2017. PMID: 28534115 Free PMC article. Review.
-
Complexities of modeling the bone marrow microenvironment to facilitate hematopoietic research.Exp Hematol. 2024 Jul;135:104233. doi: 10.1016/j.exphem.2024.104233. Epub 2024 May 11. Exp Hematol. 2024. PMID: 38740324 Review.
Cited by
-
An IL-10/DEL-1 axis supports granulopoiesis and survival from sepsis in early life.Nat Commun. 2024 Jan 23;15(1):680. doi: 10.1038/s41467-023-44178-y. Nat Commun. 2024. PMID: 38263289 Free PMC article.
-
The extracellular matrix of hematopoietic stem cell niches.Adv Drug Deliv Rev. 2022 Feb;181:114069. doi: 10.1016/j.addr.2021.114069. Epub 2021 Nov 25. Adv Drug Deliv Rev. 2022. PMID: 34838648 Free PMC article. Review.
-
The role of extracellular matrix stiffness in megakaryocyte and platelet development and function.Am J Hematol. 2018 Mar;93(3):430-441. doi: 10.1002/ajh.25008. Epub 2018 Jan 12. Am J Hematol. 2018. PMID: 29247535 Free PMC article. Review.
-
Metabolic underpinnings of leukemia pathology and treatment.Cancer Rep (Hoboken). 2019 Apr;2(2):e1139. doi: 10.1002/cnr2.1139. Epub 2018 Oct 7. Cancer Rep (Hoboken). 2019. PMID: 32721091 Free PMC article. Review.
-
Regulatory pathways associated with bone loss and bone marrow adiposity caused by aging, chemotherapy, glucocorticoid therapy and radiotherapy.Am J Stem Cells. 2012 Nov 30;1(3):205-24. Print 2012. Am J Stem Cells. 2012. PMID: 23671809 Free PMC article.
References
-
- Schofield R. The relationship between the spleen colony-forming cell and the haemopoietic stem cell. Blood Cells. 1978;4(1-2):7–25. - PubMed
-
- Moore KA, Lemischka IR. Stem cells and their niches. Science. 2006;311(5769):1880–1885. - PubMed
-
- Wilson A, Trumpp A. Bone-marrow haematopoietic-stem-cell niches. Nat Rev Immunol. 2006;6(2):93–106. - PubMed
-
- Taichman RS. Blood and bone: two tissues whose fates are intertwined to create the hematopoietic stem-cell niche. Blood. 2005;105(7):2631–2639. - PubMed
-
- Arai F, Hirao A, Ohmura M, et al. Tie2 / angiopoietin-1 signaling regulates hematopoietic stem cell quiescence in the bone marrow niche. Cell. 2004;118(2):149–161. - PubMed
Publication types
MeSH terms
Substances
LinkOut - more resources
Full Text Sources
Other Literature Sources
Medical
Molecular Biology Databases
Research Materials
Miscellaneous
