

EVI1 is critical for the pathogenesis of a subset of MLL-AF9-rearranged AMLs
- PMID: 22553314
- PMCID: PMC3382941
- DOI: 10.1182/blood-2011-11-393827
EVI1 is critical for the pathogenesis of a subset of MLL-AF9-rearranged AMLs
Abstract
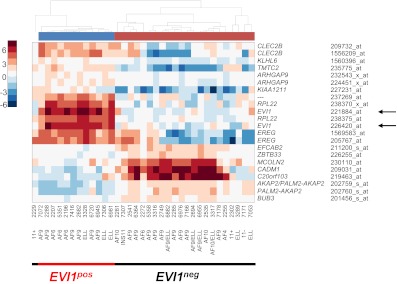
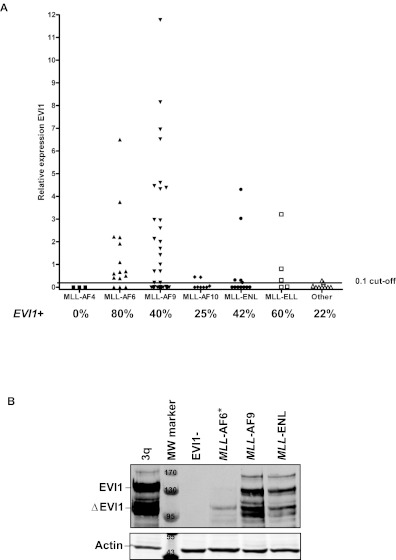
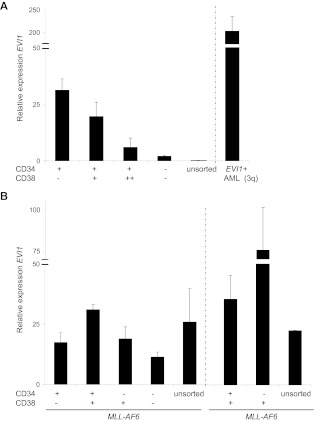
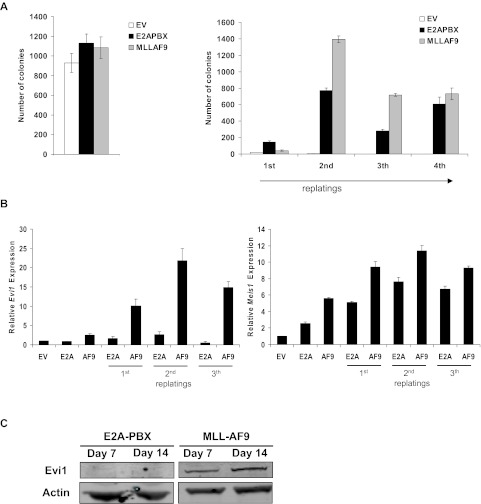
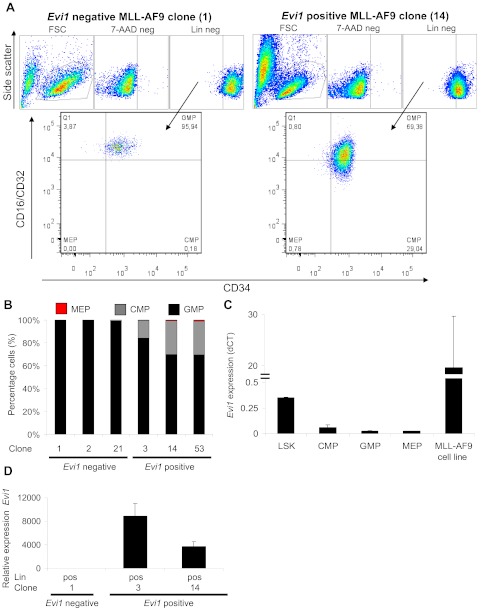
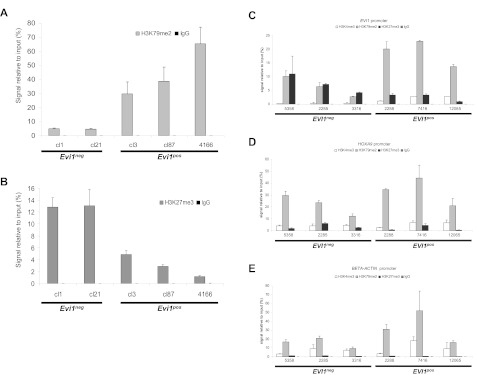
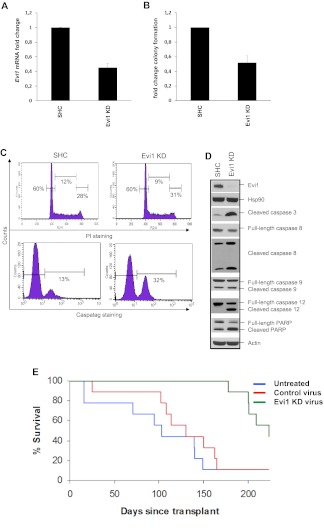
The proto-oncogene EVI1 (ecotropic viral integration site-1), located on chromosome band 3q26, is aberrantly expressed in human acute myeloid leukemia (AML) with 3q26 rearrangements. In the current study, we showed, in a large AML cohort carrying 11q23 translocations, that ∼ 43% of all mixed lineage leukemia (MLL)-rearranged leukemias are EVI1(pos). High EVI1 expression occurs in AMLs expressing the MLL-AF6, -AF9, -AF10, -ENL, or -ELL fusion genes. In addition, we present evidence that EVI1(pos) MLL-rearranged AMLs differ molecularly, morphologically, and immunophenotypically from EVI1(neg) MLL-rearranged leukemias. In mouse bone marrow cells transduced with MLL-AF9, we show that MLL-AF9 fusion protein maintains Evi1 expression on transformation of Evi1(pos) HSCs. MLL-AF9 does not activate Evi1 expression in MLL-AF9-transformed granulocyte macrophage progenitors (GMPs) that were initially Evi1(neg). Moreover, shRNA-mediated knockdown of Evi1 in an Evi1(pos) MLL-AF9 mouse model inhibits leukemia growth both in vitro and in vivo, suggesting that Evi1 provides a growth-promoting signal. Using the Evi1(pos) MLL-AF9 mouse leukemia model, we demonstrate increased sensitivity to chemotherapeutic agents on reduction of Evi1 expression. We conclude that EVI1 is a critical player in tumor growth in a subset of MLL-rearranged AMLs.
Figures
Similar articles
-
Deregulated expression of EVI1 defines a poor prognostic subset of MLL-rearranged acute myeloid leukemias: a study of the German-Austrian Acute Myeloid Leukemia Study Group and the Dutch-Belgian-Swiss HOVON/SAKK Cooperative Group.J Clin Oncol. 2013 Jan 1;31(1):95-103. doi: 10.1200/JCO.2011.41.5505. Epub 2012 Sep 24. J Clin Oncol. 2013. PMID: 23008312
-
EVI1 overexpression is a poor prognostic factor in pediatric patients with mixed lineage leukemia-AF9 rearranged acute myeloid leukemia.Haematologica. 2014 Nov;99(11):e225-7. doi: 10.3324/haematol.2014.107128. Epub 2014 Jul 11. Haematologica. 2014. PMID: 25015941 Free PMC article. No abstract available.
-
MiR-495 is a tumor-suppressor microRNA down-regulated in MLL-rearranged leukemia.Proc Natl Acad Sci U S A. 2012 Nov 20;109(47):19397-402. doi: 10.1073/pnas.1217519109. Epub 2012 Nov 6. Proc Natl Acad Sci U S A. 2012. PMID: 23132946 Free PMC article.
-
Learning from mouse models of MLL fusion gene-driven acute leukemia.Biochim Biophys Acta Gene Regul Mech. 2020 Aug;1863(8):194550. doi: 10.1016/j.bbagrm.2020.194550. Epub 2020 Apr 19. Biochim Biophys Acta Gene Regul Mech. 2020. PMID: 32320749 Review.
-
Exploring the contribution of Zfp521/ZNF521 on primary hematopoietic stem/progenitor cells and leukemia progression.Cell Tissue Res. 2024 Dec;398(3):161-173. doi: 10.1007/s00441-024-03926-2. Epub 2024 Oct 22. Cell Tissue Res. 2024. PMID: 39436449 Free PMC article. Review.
Cited by
-
MECOM Deficiency: from Bone Marrow Failure to Impaired B-Cell Development.J Clin Immunol. 2023 Aug;43(6):1052-1066. doi: 10.1007/s10875-023-01545-0. Epub 2023 Jul 5. J Clin Immunol. 2023. PMID: 37407873 Review.
-
All-trans retinoic acid enhances, and a pan-RAR antagonist counteracts, the stem cell promoting activity of EVI1 in acute myeloid leukemia.Cell Death Dis. 2019 Dec 10;10(12):944. doi: 10.1038/s41419-019-2172-2. Cell Death Dis. 2019. PMID: 31822659 Free PMC article.
-
The Impact of the Cellular Origin in Acute Myeloid Leukemia: Learning From Mouse Models.Hemasphere. 2019 Jan 30;3(1):e152. doi: 10.1097/HS9.0000000000000152. eCollection 2019 Feb. Hemasphere. 2019. PMID: 31723801 Free PMC article. Review.
-
EVI1 Promotes the Proliferation and Invasive Properties of Human Head and Neck Squamous Cell Carcinoma Cells.Int J Mol Sci. 2022 Jan 19;23(3):1050. doi: 10.3390/ijms23031050. Int J Mol Sci. 2022. PMID: 35162973 Free PMC article.
-
Comprehensive diagnostics of acute myeloid leukemia by whole transcriptome RNA sequencing.Leukemia. 2021 Jan;35(1):47-61. doi: 10.1038/s41375-020-0762-8. Epub 2020 Mar 3. Leukemia. 2021. PMID: 32127641 Free PMC article.
References
-
- Bullinger L, Döhner K, Bair E, et al. Use of gene-expression profiling to identify subclasses in adult acute myeloid leukemia. N Engl J Med. 2004;350(16):1605–1616. - PubMed
-
- Valk PJ, Verhaak RG, Beijen MA, et al. Prognostically useful gene-expression profiles in acute myeloid leukemia. N Engl J Med. 2004;350(16):1617–1628. - PubMed
-
- Morishita K, Parker DS, Mucenski ML, et al. Retroviral activation of a novel gene encoding a zinc finger protein in IL-3-dependent myeloid leukemia cell lines. Cell. 1988;54(6):831–840. - PubMed
Publication types
MeSH terms
Substances
Grants and funding
LinkOut - more resources
Full Text Sources
Other Literature Sources
Medical
