. 2012 Jul;86(14):7530-43.
doi: 10.1128/JVI.07021-11. Epub 2012 May 2.

The human T-lymphotropic virus type 1 tax protein inhibits nonsense-mediated mRNA decay by interacting with INT6/EIF3E and UPF1

Affiliations

The human T-lymphotropic virus type 1 tax protein inhibits nonsense-mediated mRNA decay by interacting with INT6/EIF3E and UPF1

Vincent Mocquet et al. J Virol. 2012 Jul.

Abstract

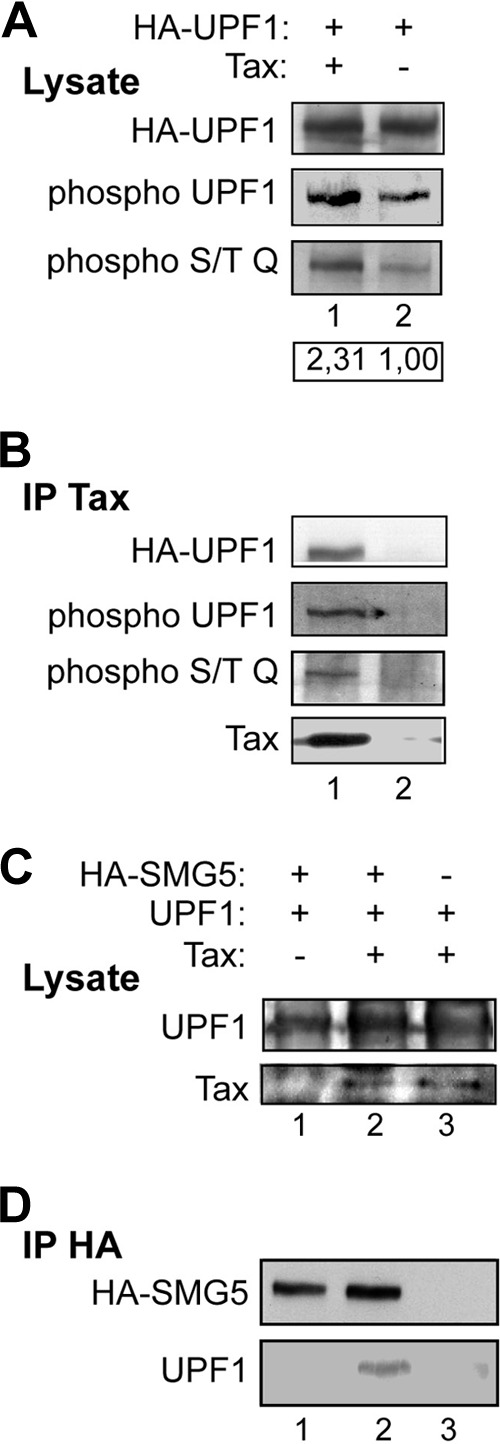
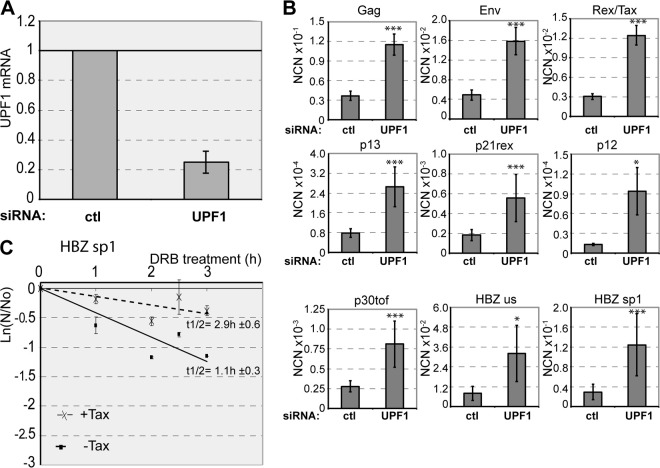
In this report, we analyzed whether the degradation of mRNAs by the nonsense-mediated mRNA decay (NMD) pathway was affected in human T-lymphotropic virus type 1 (HTLV-1)-infected cells. This pathway was indeed strongly inhibited in C91PL, HUT102, and MT2 cells, and such an effect was also observed by the sole expression of the Tax protein in Jurkat and HeLa cells. In line with this activity, Tax binds INT6/EIF3E (here called INT6), which is a subunit of the translation initiation factor eukaryotic initiation factor 3 (eIF3) required for efficient NMD, as well as the NMD core factor upstream frameshift protein 1 (UPF1). It was also observed that Tax expression alters the morphology of processing bodies (P-bodies), the cytoplasmic structures which concentrate RNA degradation factors. The presence of UPF1 in these subcellular compartments was increased by Tax, whereas that of INT6 was decreased. In line with these effects, the level of the phosphorylated form of UPF1 was increased in the presence of Tax. Analysis of several mutants of the viral protein showed that the interaction with INT6 is necessary for NMD inhibition. The alteration of mRNA stability was observed to affect viral transcripts, such as that coding for the HTLV-1 basic leucine zipper factor (HBZ), and also several cellular mRNAs sensitive to the NMD pathway. Our data indicate that the effect of Tax on viral and cellular gene expression is not restricted to transcriptional control but can also involve posttranscriptional regulation.


Figures

Fig 1
Fig 1
Effect of Tax on stability of NMD-prone mRNA. (A) NMD assays were performed with the indicated cell lines. The Renilla luciferase activity from the GlNS39 plasmid was normalized and expressed as a percentage of that from the GlWT plasmid. The bar graph represents mean values, with error bars corresponding to standard deviations. The Student t test corresponds to Tax-expressing cell lines versus non-Tax-expressing cell lines, as indicated (**, P < 0.01). (B) Extracts from panel A were analyzed by immunoblotting with antibodies to Tax (top) and to β-actin (bottom). (C) NMD assays were performed with JPX9 cells without (0 h) or with Tax induction for 3 h or 6 h. The 6 h+W48h bar corresponds to cells washed and further cultured for 48 h after 6 h of induction (*, P < 0.05; **, P < 0.01 [Student's t test results refer to the 0-h conditions, except for 6 h+W48 {6 h of induction}]). (D) Extracts used in panel C were analyzed by immunoblotting with antibodies to Tax and to β-actin. (E) NMD assays were performed with HeLa cells in the absence (lanes 1 and 3) or in the presence (lanes 2 and 4) of Tax expression, without (lanes 1 and 2) or with (lanes 3 and 4) the addition of 100 μg/ml DRB for 3 h. The percentage of GlNS39 mRNA with respect to GlWT mRNA is represented as described above for panel A. (F) Extracts used in panel E were analyzed by immunoblotting with an antibody to Tax.
Fig 2
Fig 2
Interaction of Tax with NMD factors. (A) Extracts of Jurkat (lane 1) and HUT102 (lane 2) cells treated with RNase A were analyzed by immunoblotting with antibodies to UPF2, UPF1, INT6, and Tax. Using these Jurkat (lane 3) and HUT102 (lane 4) cell extracts, immunoprecipitation (IP) with an antibody to Tax was carried out, and the immunoprecipitates were analyzed by immunoblotting with the same set of antibodies. (B) GST, GST-Tax, and UPF1 were produced in bacteria and purified. UPF1 was mixed with GST-Tax (lane 1) or GST (lane 2), and a GST pulldown was carried out. The presence of UPF1 (middle) and Tax (bottom) in the eluates was assessed by immunoblotting. The top panel corresponds to 2% of the input. (C) Same as B, with purified INT6 instead of UPF1. (D) Purified INT6 and UPF1 were mixed, and immunoprecipitation was carried out with the N-19 antibody to INT6 (lane 1). The immunoprecipitate was analyzed by immunoblotting with antibodies to UPF1 (middle) and to INT6 (bottom). As a control, the same experiment was done in the absence of purified INT6 (lane 2).
Fig 3
Fig 3
Network of interactions between Tax, INT6, UPF1, and UPF2. (A) Extracts of 293T cells transfected with Tax, INT6-FLAG, HA-UPF1, and HA-UPF2 expression vectors, as indicated, were used for immunoprecipitations using the antibody to the HA epitope. Immunoprecipitates were analyzed by immunoblotting using antibodies to HA (top), UPF1 (top middle), FLAG (bottom middle), and Tax (bottom). Ig marks the signal of the immunoglobulin heavy chain. (B) The same extracts were also immunoprecipitated with an antibody to Tax, and immunoprecipitates were analyzed by immunoblotting with antibodies to HA (top), FLAG (middle), and Tax (bottom). (C) 293T cells were transfected with either control (luciferase) (lane 1) or anti-UPF1 (lanes 2 and 3) siRNA duplexes as well as with vectors expressing Tax (lanes 1 to 3) and HA-UPF2 (lanes 1 and 3). Protein levels of endogenous UPF1 (top) and Tax (bottom) were monitored by immunoblotting. (D) Extracts of these transfected cells were used for immunoprecipitations carried out with the antibody to HA, and immunoprecipitates were analyzed by immunoblotting with antibodies to HA (top) and to Tax (bottom). (E) 293T cells were transfected with vectors expressing HA-UPF1, either the wild type (lanes 1 and 2) or including the C126S mutation (lanes 3 and 4) and Tax (lanes 1 and 3). Tax expression in the cell extracts was monitored by immunoblotting. (F) Extracts of these transfected cells were used for immunoprecipitations using the antibody to HA, and coimmunoprecipitated proteins were analyzed by immunoblotting with antibodies to HA (top) and to Tax (bottom).
Fig 4
Fig 4
Colocalization of Tax and NMD factors with P-bodies. (A) Confocal microscopy analysis of HeLa cells transfected with HA-UPF1 and DCP1-RFP expression vectors together with a control (a to e) or Tax (f to j) expression vector. Immunostaining was done with antibodies to Tax (blue) (a and f) and to HA (green) (b and g). The DCP1-RFP fluorescence was also analyzed (red) (c and h). Panels d and i correspond to the superposition of the three fluorescences, with the nucleus limits identified from the transmission view, highlighted with a white line. Panels e and j correspond to the superposition of all three fluorescences with the transmission view. (B) Quantification of the UPF1 foci observed in the absence or presence of Tax. The numbers of UPF1 foci in several cells (n = 10) were determined, and the mean number of foci under both conditions is represented (green, without Tax; red, with Tax), with error bars corresponding to standard deviations. The statistical significance of the difference between both conditions was calculated with Welch's t test and is indicated on the graph. (C) Similarly to panel B, the UPF1 fluorescence in the cytoplasm outside the foci, in the cytoplasmic foci, and in the nucleus in the absence or the presence of Tax was quantified and is represented in a bar graph. (D) Confocal microscopy analysis of HeLa cells transfected with vectors coding for the P-body components p54-GFP and DCP1-RFP without or with 0.1 μg of the Tax-expressing plasmid. Immunostaining of Tax appears in blue (a and f), along with p54-GFP fluorescence (green) (b and g) and DCP1-RFP fluorescence (red) (c and h). Panels d and i correspond to a superposition of the three fluorescences, and panels e and j correspond to an enlargement of this image.
Fig 5
Fig 5
Tax stabilizes the phosphorylated forms of UPF1. (A) 293T cells were transfected with Tax and HA-UPF1 expression vectors, as indicated. Cell extracts were analyzed by immunoblotting with an antibody to HA (top), phosphorylated UPF1 (middle), or phosphorylated S/TQ motifs (bottom). The signals of phosphorylated UPF1 were quantified by densitometric analysis and normalized to those corresponding to total UPF1. The ratios of phosphorylated UPF1/total UPF1 are indicated below the blot images. (B) Extracts from panel A were immunoprecipitated with an antibody to Tax, and immunoprecipitates were analyzed by immunoblotting with the indicated antibodies. (C) 293T cells were transfected with HA-SMG5, UPF1, and Tax expression vectors, as indicated. Cell extracts were analyzed by immunoblotting using antibodies to UPF1 (top) and to Tax (bottom). (D) Extracts from panel C were immunoprecipitated with the antibody to HA, and immunoprecipitates were analyzed with antibodies to HA (top) and to UPF1 (bottom).
Fig 6
Fig 6
Tax mutants affect NMD efficiencies differently. (A) NMD assays were carried out, as described in the legend of Fig. 1A, with the cotransfection of control (−), wild-type (WT) Tax, Tax M22, Tax M47, and Tax K1-10R expression vectors (*, P < 0.05 [Student's t test P values refer to the control point {−}]). (B) Cells were transfected with the HA-UPF1, INT6-FLAG, and Tax expression vectors, as indicated. Extracts from these cells were analyzed by immunoblotting with antibodies to HA (top) and to FLAG (bottom). (C) Extracts from panel B were immunoprecipitated by using an antibody to Tax, and immunoprecipitates were analyzed with antibodies to HA (top), FLAG (middle), and Tax (bottom). Ig marks the immunoglobulin heavy chain. (D) Signals corresponding to HA-UPF1 and to INT6-FLAG in the immunoprecipitates from panel C were quantified and normalized to the signals detected in the extracts. The mean values obtained from three experiments are represented in a bar graph, with error bars corresponding to standard deviations. (E) Confocal microscopy analysis of HeLa cells transfected with constructs expressing DCP1-RFP together with a control (a) or vectors expressing either WT Tax (b and e), Tax M22 (c and f), or Tax M47 (d and g). The fluorescence from DCP1-RFP (red) and Tax immunostaining (green) is shown. The proportions of normal P-bodies (n < 9 and a diameter of <1.5 μm) and unusual P-bodies (n > 9 and/or a diameter of >1.5 μm) are presented in a bar graph.
Fig 7
Fig 7
HTLV-1 mRNAs are sensitive to NMD. (A) HeLa cells were transfected first with 20 pmol of a control or UPF1 siRNA and 48 h later with the HTLV-1 molecular clone construct pACH. UPF1 mRNA from these cells was quantified to control the silencing efficiency. (B) Using these cells, the normalized copy number (NCN) of the various HTLV-1 transcripts in control and UPF1-silenced cells was determined by qRT-PCR. The mean values obtained from six experimental points are presented in the bar graphs for each viral transcript, with error bars corresponding to standard deviations. The results of Student's t tests are also indicated (*, P < 0.05; ***, P < 0.001). (C) The half-life of the HBZ sp1 mRNA was measured in HeLa cells transfected with or without Tax. The amounts of HBZ mRNA were measured by qRT-PCR at each time point after the addition of DRB and normalized to Renilla mRNA levels, and the natural logarithm of the values, expressed as fractions to time zero, were plotted against time.
Fig 8
Fig 8
(A) The half-life of the GADD45α mRNA was measured in noninduced (squares and full line) and 6-h-induced (crosses and dotted line) JPX9 cells. The amounts of GADD45α mRNA were measured by qRT-PCR at each time point after the addition of DRB and normalized to GAPDH mRNA levels, and the natural logarithms of the values, expressed as fractions to time zero, were plotted against time. Each point corresponds to the mean of data from three independent measurements, and error bars indicate standard deviations. The half-life of the mRNA under both conditions was calculated and is indicated in the graph. (B to E) Same as in panel A but for BAG1 (B), ATF4/CREB-2 (C), SLIT2 (D), and MAP3K14 mRNAs (E). (F) Zero hours, 1.5 h, and 4 h after the addition of DRB, extracts of noninduced (lanes 1 to 3) or 6-h-induced (lanes 4 to 6) JPX9 cells were prepared and analyzed by immunoblotting using antibodies to Tax (top) and to β-actin (bottom).
Fig 9
Fig 9
Summary scheme of the effect of Tax on the NMD pathway. In the case of an NMD-prone mRNA, UPF1 is phosphorylated by the SMG1 kinase and associates with UPF2 and UPF3. Under these conditions, UPF1 represses translation initiation by interacting with eIF3. Phosphorylated UPF1 also triggers an association with mRNA decay factors such as DCP1, XRN1, and the exosome component EXOSC2. After mRNA routing toward P-bodies, it is considered that UPF1 is dephosphorylated by the SMG5/7-PP2A complex and recycled (left bottom part of the scheme). In Tax-expressing cells, from the data presented in this report, Tax binds INT6, thereby impairing the INT6-UPF1 association. Tax also binds phospho-UPF1 and presumably prevents its normal dephosphorylation by PP2A, thus causing an accumulation of phospho-UPF1 in the P-bodies (right bottom part of the scheme). These combined effects lead to the stabilization of cellular as well as viral mRNAs by inhibiting their degradation.

Similar articles

Cited by

References

    1. Abbas S, Erpelinck-Verschueren CA, Goudswaard CS, Lowenberg B, Valk PJ. 2010. Mutant Wilms' tumor 1 (WT1) mRNA with premature termination codons in acute myeloid leukemia (AML) is sensitive to nonsense-mediated RNA decay (NMD). Leukemia 24:660–663 - PubMed
    1. Amor S, et al. 2010. Alternative splicing and nonsense-mediated decay regulate telomerase reverse transcriptase (TERT) expression during virus-induced lymphomagenesis in vivo. BMC Cancer 10:571 doi:10.1186/1471-2407-10-571 - DOI - PMC - PubMed
    1. Anczukow O, et al. 2008. Does the nonsense-mediated mRNA decay mechanism prevent the synthesis of truncated BRCA1, CHK2, and p53 proteins? Hum. Mutat. 29:65–73 - PubMed
    1. Asano K, Phan L, Anderson J, Hinnebusch AG. 1998. Complex formation by all five homologues of mammalian translation initiation factor 3 subunits from yeast Saccharomyces cerevisiae. J. Biol. Chem. 273:18573–18585 - PubMed
    1. Barbier J, et al. 2007. Regulation of H-ras splice variant expression by cross talk between the p53 and nonsense-mediated mRNA decay pathways. Mol. Cell. Biol. 27:7315–7333 - PMC - PubMed

Publication types

MeSH terms