. 2012 Jun;23(12):2275-91.
doi: 10.1091/mbc.E12-02-0117. Epub 2012 May 2.

Spindle checkpoint-independent inhibition of mitotic chromosome segregation by Drosophila Mps1

Affiliations

Spindle checkpoint-independent inhibition of mitotic chromosome segregation by Drosophila Mps1

Friederike Althoff et al. Mol Biol Cell. 2012 Jun.

Abstract

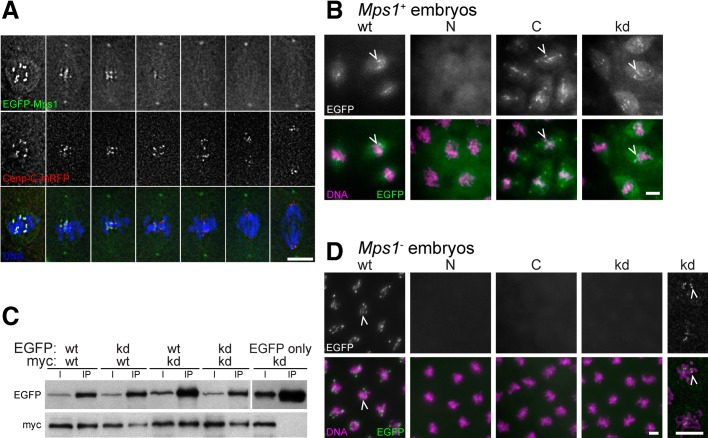
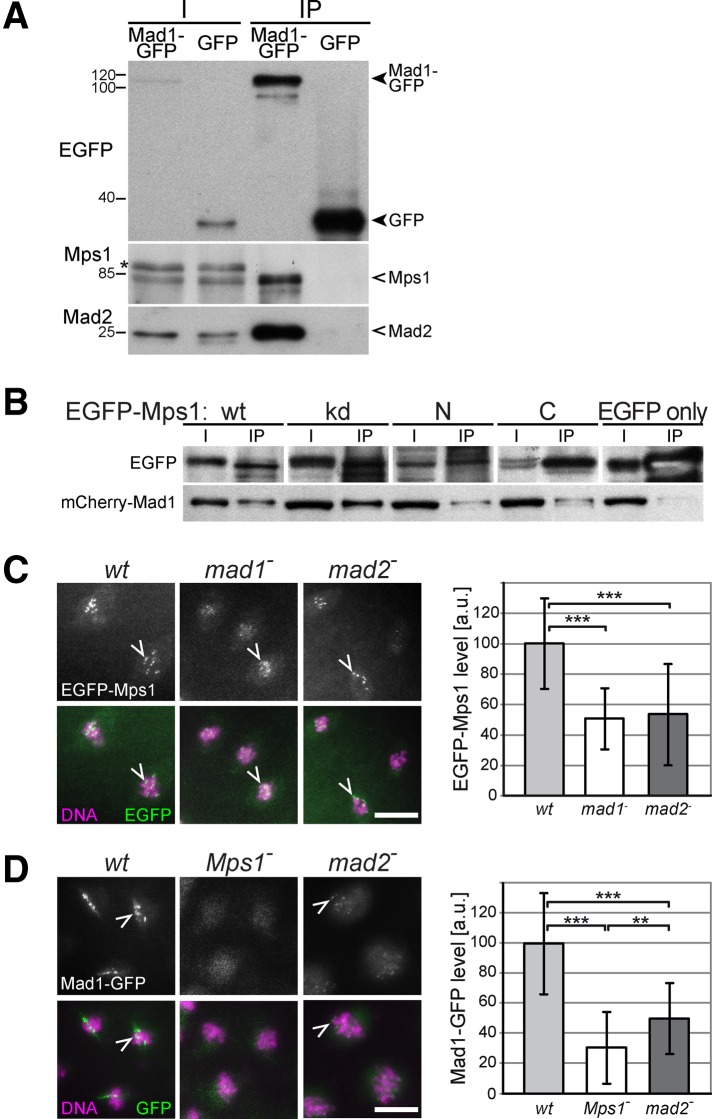
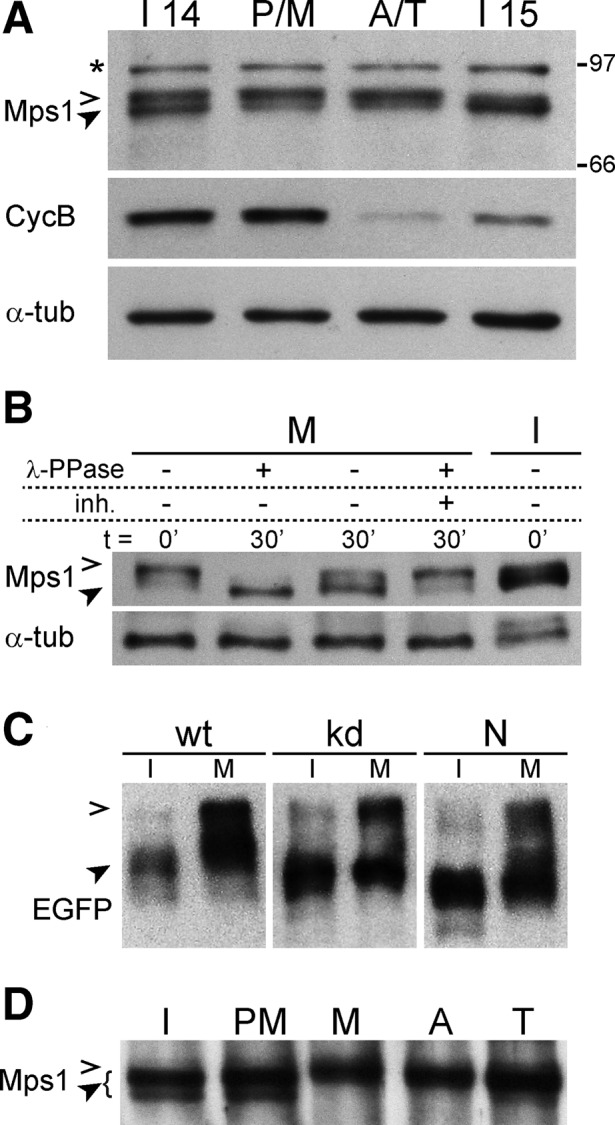
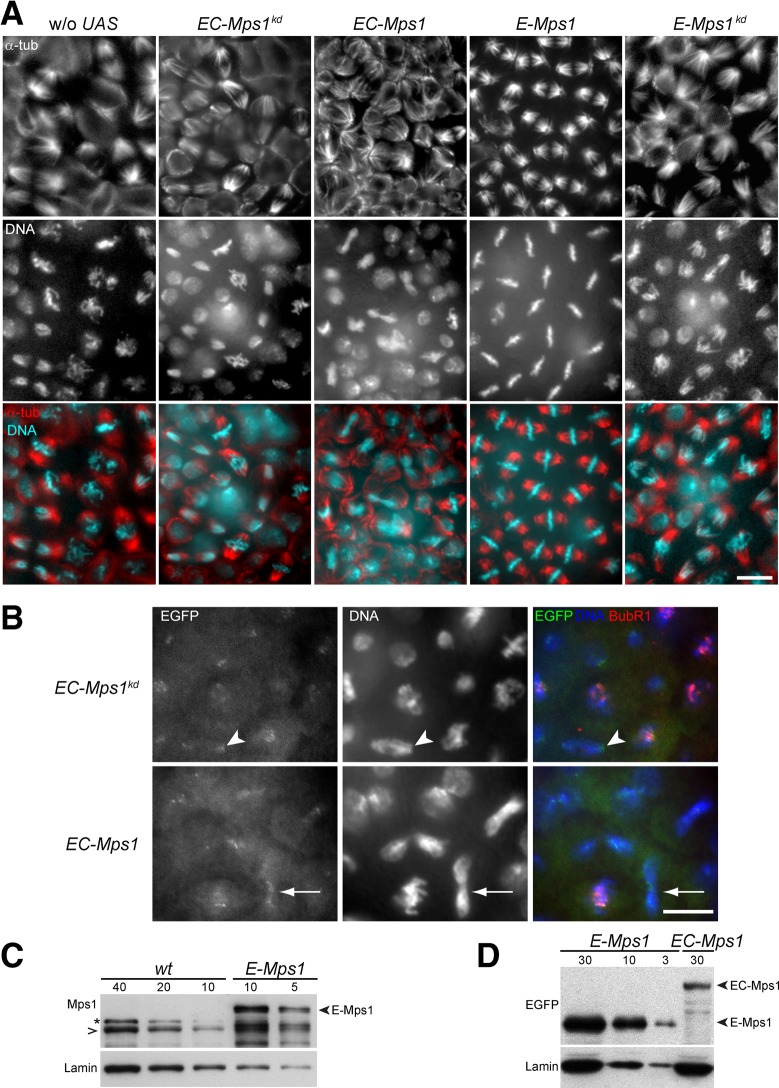
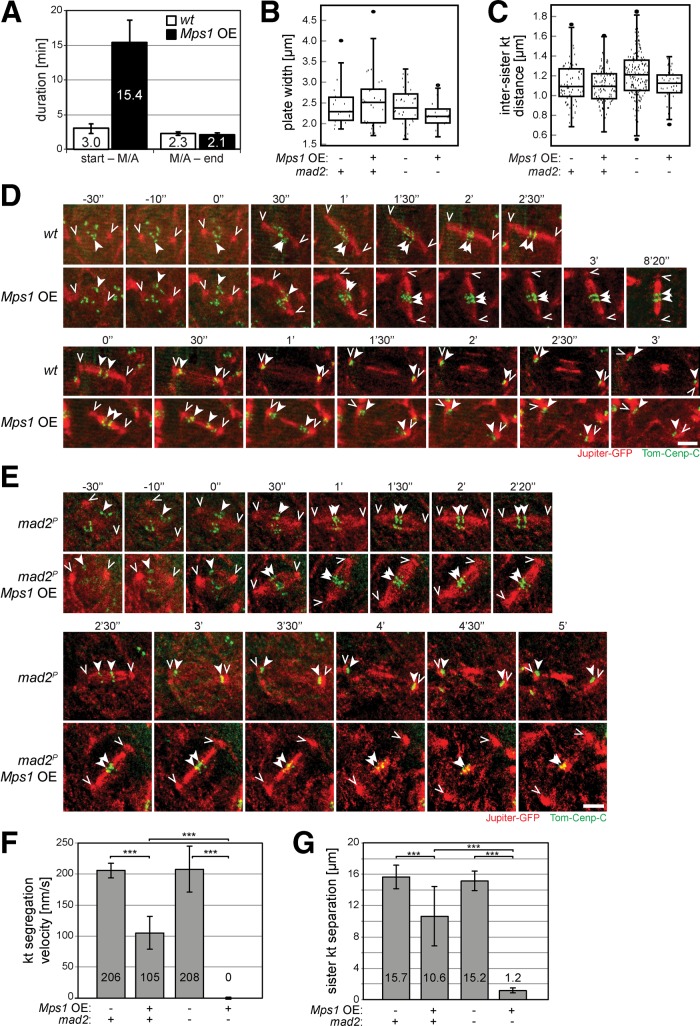
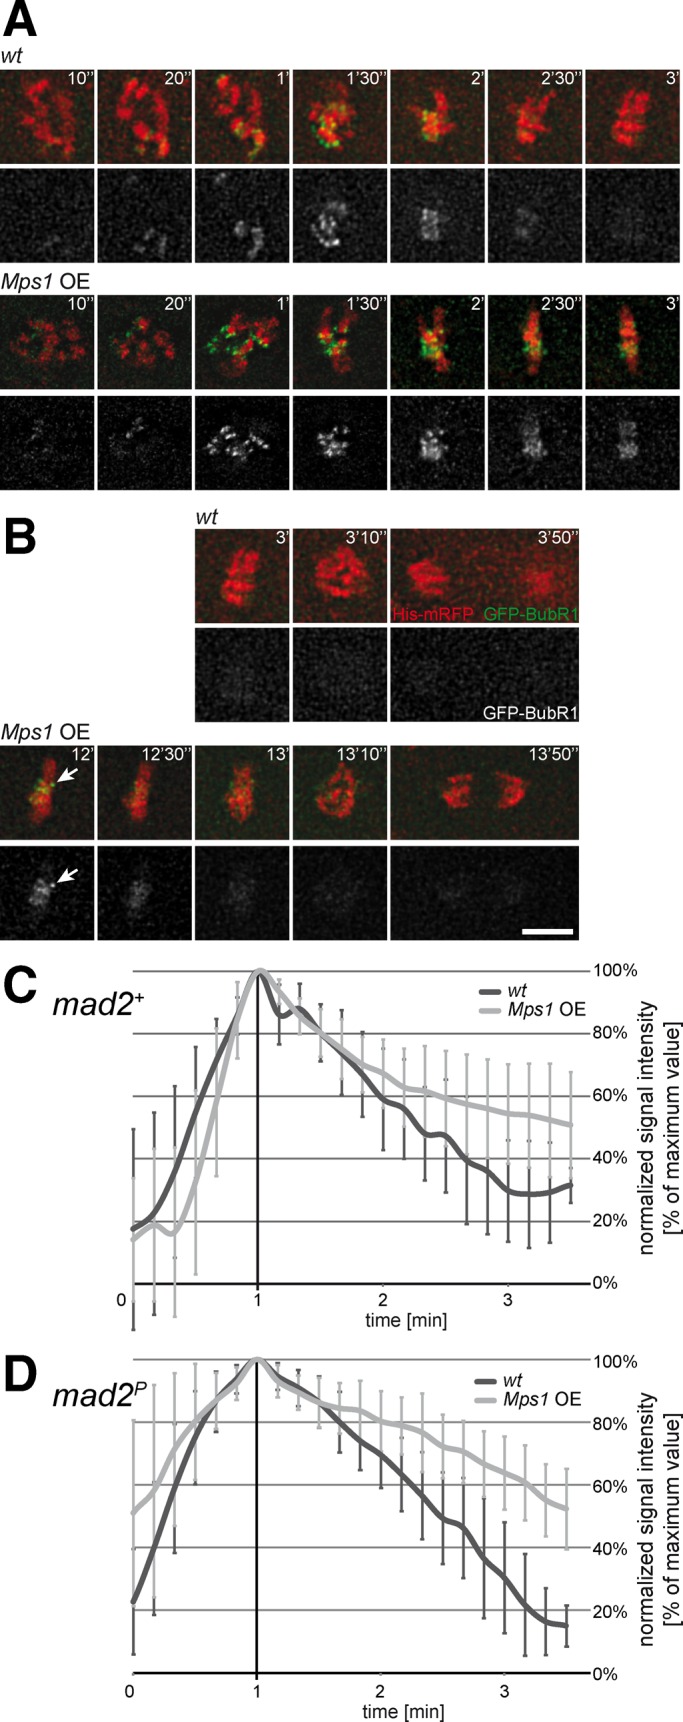
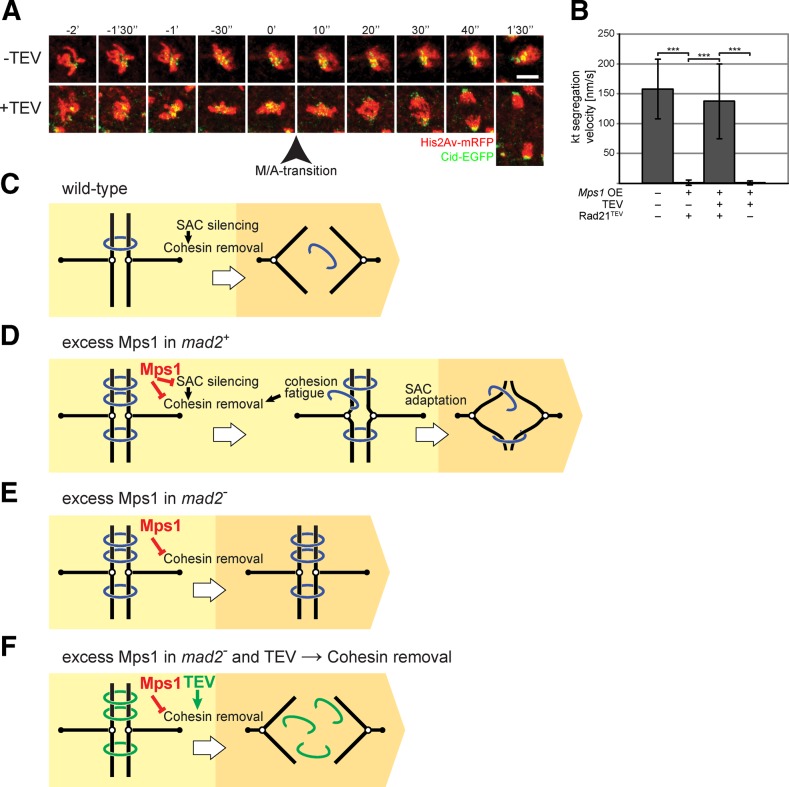
Monopolar spindle 1 (Mps1) is essential for the spindle assembly checkpoint (SAC), which prevents anaphase onset in the presence of misaligned chromosomes. Moreover, Mps1 kinase contributes in a SAC-independent manner to the correction of erroneous initial attachments of chromosomes to the spindle. Our characterization of the Drosophila homologue reveals yet another SAC-independent role. As in yeast, modest overexpression of Drosophila Mps1 is sufficient to delay progression through mitosis during metaphase, even though chromosome congression and metaphase alignment do not appear to be affected. This delay in metaphase depends on the SAC component Mad2. Although Mps1 overexpression in mad2 mutants no longer causes a metaphase delay, it perturbs anaphase. Sister kinetochores barely move apart toward spindle poles. However, kinetochore movements can be restored experimentally by separase-independent resolution of sister chromatid cohesion. We propose therefore that Mps1 inhibits sister chromatid separation in a SAC-independent manner. Moreover, we report unexpected results concerning the requirement of Mps1 dimerization and kinase activity for its kinetochore localization in Drosophila. These findings further expand Mps1's significance for faithful mitotic chromosome segregation and emphasize the importance of its careful regulation.


Figures

FIGURE 1:
FIGURE 1:
Localization and self-interaction of wild-type and mutant Mps1. (A) Mitotic figures from a mitotic wave in a syncytial-stage Drosophila embryo expressing EGFP-Mps1 and the centromere protein Cenp-C-mRFP after fixation and DNA labeling reveal peak levels of Mps1 at kinetochores during prometaphase (left), followed by disappearance from the kinetochore during progression into anaphase (right). EGFP-Mps1 is also detectable on centrosomes and weakly on the spindle. (B) Prometaphase figures from syncytial Mps1+ embryos expressing the following EGFP-tagged Mps1 variants: wild-type (wt), N-terminal regulatory domain (N), C-terminal kinase domain (C), and kinase-dead Mps1kd (kd). Arrowheads indicate kinetochore localization. (C) Larval extracts were used for immunoprecipitation with anti-EGFP after coexpression of an EGFP- and a myc-tagged Mps1 variant during a developmental stage with minimal endogenous Mps1 expression. Immunoblotting of extracts (I) and immunoprecipitates (IP) with anti-EGFP and anti-myc revealed coimmunoprecipitation of the tagged variants. Anti-EGFP does not coimmunoprecipitate myc-Mps1kd from extracts of larvae expressing EGFP only instead of EGFP-Mps1, indicating the specificity of the Mps1 self-interaction. Loading was 1 and 15 larvae equivalents in I and IP lanes, respectively. (D) Prometaphase figures from syncytial Mps1 embryos expressing the EGFP-tagged Mps1 variants described in B. Arrowheads indicate kinetochore localization. In the case of EGFP-Mps1kd, some residual kinetochore localization is only apparent after contrast enhancement (rightmost panels at higher magnification). Bars, 5 μm.
FIGURE 2:
FIGURE 2:
Mps1–Mad1 interaction and kinetochore localization dependences. (A) Extracts from embryos expressing either Mad1-GFP or GFP only were used for immunoprecipitation with anti-EGFP. Immunoblotting of extracts (I) and immunoprecipitates (IP) with anti-EGFP, anti-Mps1, and anti-Mad2 revealed that Mps1 and Mad2 are coimmunoprecipitated specifically with Mad1-EGFP. Loading was 30 and 925 embryo equivalents in I and IP lanes, respectively. The position of molecular weight markers is indicated on the left. A cross-reaction of anti-Mps1 is marked with an asterisk. (B) Extracts from embryos expressing mCherry-Mad1 and EGFP-tagged wild-type (wt), kinase-dead (kd), N-terminal (N), or C-terminal domain (C) of Mps1 were used for immunoprecipitation with anti-EGFP. Immunoblotting of extracts (I) and immunoprecipitates (IP) with anti-EGFP (EGFP) and anti-mCherry (mCherry-Mad1) indicated that all of the Mps1 variants associate with Mad1, although with reduced efficiency in case of the N- and C-terminal domains. However, even less mCherry-Mad1 was coimmunoprecipitated when EGFP only instead of an Mps1 fusion was expressed. Loading was 30 and 300 embryo equivalents in I and IP lanes, respectively. (C) Kinetochore localization of EGFP-Mps1 during prometaphase was analyzed in syncytial embryos from mothers that were wild type (wt), mad1, or mad2. (D) Kinetochore localization of Mad1-GFP during prometaphase was analyzed in syncytial embryos from mothers that were wild type (wt), Mps1, or mad2 (only in the germline in case of Mps1). Bars, 10 μm (C, D) . Arrowheads indicate kinetochore signals. Kinetochore signals were quantified (bar diagrams) using arbitrary units with error bars representing SD. Brackets indicate statistically significant differences (t test) with **p < 0.01 and ***p < 0.001.
FIGURE 3:
FIGURE 3:
Mps1 stability and phosphorylation during mitosis. Progression through a synchronous mitosis 14 was induced in embryos. Extracts from microscopically selected embryos before mitosis (I14), in prophase and metaphase (P/M), in anaphase and telophase (A/T), and in the subsequent interphase (I15) were analyzed by immunoblotting with antibodies against Mps1, cyclin B, and α-tubulin (loading control) indicating that Mps1 levels do not decrease significantly during exit from mitosis. (B) Extracts from syncytial embryos in mitosis (M) or interphase (I) with (+) or without (–) pretreatment using λ-phosphatase (λ-PPase) and phosphatase inhibitors (inh.) for the indicated times were analyzed by immunoblotting with anti-Mps1 and anti–α-tubulin. (C) Extracts from Mps1-mutant embryos expressing EGFP-tagged wild-type (wt), kinase-dead (kd), or N-terminal domain (N) of Mps1 in interphase (I) or mitosis (M) were resolved on Phos-tag gels and analyzed by immunoblotting with anti-EGFP. (D) Extracts from microscopically selected syncytial embryos in interphase (I), prometaphase (PM), metaphase (M), anaphase (A), and telophase (T) were analyzed by immunoblotting with anti-Mps1. Open and filled arrowheads in A–D indicate phosphorylated low- and high-mobility forms of Mps1, respectively. A cross-reaction of anti-Mps1 is marked with an asterisk. Positions of molecular weight markers are indicated on the right.
FIGURE 4:
FIGURE 4:
Mitotic defects caused by alterations in localization and level of Mps1. The UAS/GAL4 system was used for expression of Mps1 variants in embryos before mitosis 14. (A, B) Embryos were fixed at the stage of mitosis 14. The epidermal regions with mitotic domain 10 (Foe, 1989) are displayed after labeling with anti-α-tubulin (α-tub, A), anti-BubR1 (BubR1, B), and a DNA stain (DNA, A and B). As in control embryos without a UAS transgene (w/o UAS), progression through mitosis 14 was normal after expression of kinase-dead EGFP-Cenp-CC-Mps1kd (EC-Mps1kd), which localizes to kinetochores beyond metaphase, as indicated by EGFP signals on kinetochores in anaphase (arrowhead in B). However, chromosome segregation defects during completion of mitosis were apparent after expression of EGFP-Cenp-CC-Mps1 (EC-Mps1), as revealed by DNA bridges with EGFP signals in anaphase and telophase figures (arrow in B). Whereas a strong delay in metaphase was observed after overexpression of EGFP-Mps1 (E-Mps1), progression through mitosis 14 was normal after overexpression of EGFP-Mps1kd (E-Mps1kd). Bars, 10 μm. (C, D) Expression levels of the Mps1 variants at the stage analyzed in A and B were determined by quantitative immunoblotting with antibodies against Mps1, EGFP, and lamin as loading control. Serial dilutions of embryo extracts were loaded with numbers representing embryo equivalents. (C) Compared to Mps1 in wild-type embryos (wt), EGFP-Mps1 (E-Mps1) levels were approximately fivefold higher. (D) Compared to EGFP-Mps1, EGFP-Cenp-CC-Mps1 (EC-Mps1) levels were ∼10-fold lower. A cross-reaction of anti-Mps1 is marked with an asterisk. The positions of wild-type Mps1 and EGFP fusions are indicated by open and filled arrowheads, respectively.
FIGURE 5:
FIGURE 5:
SAC effects on mitosis in presence of excess Mps1. (A) The dynamics of progression through mitosis 14 was analyzed by time-lapse in vivo imaging of embryos without (wt, white bars) or with UAS/GAL4-mediated Mps1 overexpression (Mps1 OE, black bars). Because embryos also expressed histone H2Av-mRFP and the centromere protein Cenp-A/Cid-EGFP, the duration from prophase onset until metaphase-to-anaphase transition (start–M/A), as well as from metaphase-to-anaphase transition until telophase end (M/A– end), could be determined. Bars indicate average duration (±SD) obtained from >50 mitotic cells from at least six different embryos. (B, C) The width of metaphase plates (B) and separation of sister kinetochores (C) was determined after in vivo imaging of mitosis 14 in embryos expressing the centromere protein Tomato-Cenp-C and the spindle-associated protein Jupiter-GFP (see also D and E). Moreover, embryos were either mad2+ (+) or mad2 (–) and did (+) or did not (–) overexpress Mps1 (Mps1 OE). Box plots display values determined 2 min after nuclear envelope breakdown. The t tests failed to reveal significant differences between the different genotypes. (D, E) Entry into mitosis 14 until metaphase (top) and exit from mitosis 14 (bottom) was analyzed by in vivo imaging of embryos with the same genotypes as in B and C. Comparison of mad2+ embryos (D) either without (wt) or with Mps1 overexpression (Mps1 OE) indicated that excess Mps1 resulted in a substantial metaphase delay, eventually followed by almost normal sister chromatid segregation during anaphase. In contrast, comparison of mad2 embryos (E) either without (wt) or with Mps1 overexpression (Mps1 OE) revealed that the metaphase delay induced by excess Mps1 depends on SAC function. Moreover, sister chromatid segregation was almost completely inhibited during exit from mitosis in mad2 embryos with excess Mps1. Maximum projections of selected stacks at the indicated times are shown from representative cells with spindle poles indicated by open and kinetochores by closed arrowheads. Bars correspond to 5 μm. (F, G) The speed of poleward sister kinetochore segregation during anaphase (F) and their final separation at the end of mitosis (G) in embryos with the same genotypes as in B–E were quantified. Bars represent average (±SD) from 12 mitotic cells from at least three embryos. Brackets indicate statistically significant differences (t test) with ***p < 0.001.
FIGURE 6:
FIGURE 6:
BubR1 kinetochore localization during mitosis in presence of excess Mps1. (A–C) Embryos with GFP-BubR1 and histone H2Av-mRFP either without (wt) or with UAS/GAL4-mediated Mps1 overexpression (Mps1 OE) were analyzed by time-lapse in vivo imaging. Maximum projections of selected stacks at the indicated times are shown from representative cells during (A) entry into mitosis and (B) exit from mitosis. Arrow indicates a single kinetochore retaining GFP-BubR1 during the metaphase delay induced by excess Mps1. Bar, 5 μm. (C) GFP-BubR1 signals on kinetochores were quantified over time, and curves were aligned at their peak and averaged (±SD). Although accumulation and subsequent initial disappearance of BubR1 from kinetochores was not affected by excess Mps1, this overexpression led to a slowdown of the late phase of BubR1 disappearance, presumably due to the one or two GFP-BubR1–retaining kinetochores characteristically observed during the metaphase delay caused by excess Mps1. (D) GFP-BubR1 signals on kinetochores were also analyzed in mad2-mutant embryos either without (wt) or with UAS/GAL4-mediated Mps1 overexpression (Mps1 OE). As in mad2+ embryos (A–C), excess Mps1 did not affect accumulation and subsequent initial disappearance of BubR1 from kinetochores.
FIGURE 7:
FIGURE 7:
SAC-independent inhibition of sister chromatid separation by excess Mps1. (A, B) The UAS/GAL4 system was used for Mps1 overexpression in mad2-mutant embryos before mitosis 14. These embryos also expressed histone H2Av-mRFP and Cid-EGFP, allowing in vivo imaging of progression through mitosis 14. Moreover, instead of the wild-type cohesin subunit Rad21, these embryos expressed a Rad21 version with inserted internal TEV protease cleavage sites. In the presence of a UAS-TEV transgene, therefore, separase-independent cleavage of Rad21 occurred, resulting in elimination of sister chromatid cohesion (Pauli et al., 2008). (A) Maximum projections of selected stacks at the indicated times from representative cells of embryos without (–TEV) or with UAS-TEV (+TEV) reveal that TEV expression restores an essentially normal poleward sister chromatid segregation during anaphase in the presence of excess Mps1. Bar, 5 μm. (B) Quantification of the velocity of poleward sister chromatid segregation during anaphase in mad2P His2Av-mRFP Cid-EGFP embryos with maternally derived Gal4 and variable aspects of the genotype (UAS-Mps1, UAS-TEV, rad21TEV) indicated below the bars. Seventeen mitotic cells from at least four embryos were analyzed for each genotype. Brackets indicate statistically significant differences (t test) with ***p < 0.001. (C–F) Schematic summary of progression from metaphase (yellow) into anaphase (orange) in embryos with wild-type (C) or excess levels of Mps1 (D–F). In SAC-competent mad2+ embryos (D), excess Mps1 results in metaphase extension, followed by an almost normal sister chromatid separation during anaphase, presumably because cohesion fatigue during the SAC-dependent metaphase arrest largely counteracts an inhibition of sister chromatid separation by excess Mps1. Without the extended metaphase delay, as in the SAC-deficient mad2 mutant embryos (E), an essentially complete block of sister chromatid segregation occurs during anaphase, presumably because the SAC-independent inhibition of sister chromatid separation by excess Mps1 is no longer counteracted by cohesion fatigue. However, as predicted by our interpretation, TEV-mediated elimination of cohesion restores an essentially normal sister chromatid segregation in mad2-mutant embryos with excess Mps1 (F).

Similar articles

Cited by

References

    1. Abrieu A, Magnaghi-Jaulin L, Kahana JA, Peter M, Castro A, Vigneron S, Lorca T, Cleveland DW, Labbe JC. Mps1 is a kinetochore-associated kinase essential for the vertebrate mitotic checkpoint. Cell. 2001;106:83–93. - PubMed
    1. Basu J, Bousbaa H, Logarinho E, Li Z, Williams BC, Lopes C, Sunkel CE, Goldberg ML. Mutations in the essential spindle checkpoint gene bub1 cause chromosome missegregation and fail to block apoptosis in Drosophila. J Cell Biol. 1999;146:13–28. - PMC - PubMed
    1. Brand AH, Perrimon N. Targeted gene expression as a means of altering cell fates and generating dominant phenotypes. Development. 1993;118:401–415. - PubMed
    1. Buffin E, Emre D, Karess RE. Flies without a spindle checkpoint. Nat Cell Biol. 2007;9:565–572. - PubMed
    1. Buffin E, Lefebvre C, Huang J, Gagou ME, Karess RE. Recruitment of Mad2 to the kinetochore requires the Rod/Zw10 complex. Curr Biol. 2005;15:856–861. - PubMed

Publication types

MeSH terms

LinkOut - more resources