. 2012:11:87-111.
doi: 10.4137/CIN.S8633. Epub 2012 Apr 19.

Major Functional Transcriptome of an Inferred Center Regulator of an ER(-) Breast Cancer Model System

Affiliations

Major Functional Transcriptome of an Inferred Center Regulator of an ER(-) Breast Cancer Model System

Li-Yu Daisy Liu et al. Cancer Inform. 2012.

Abstract

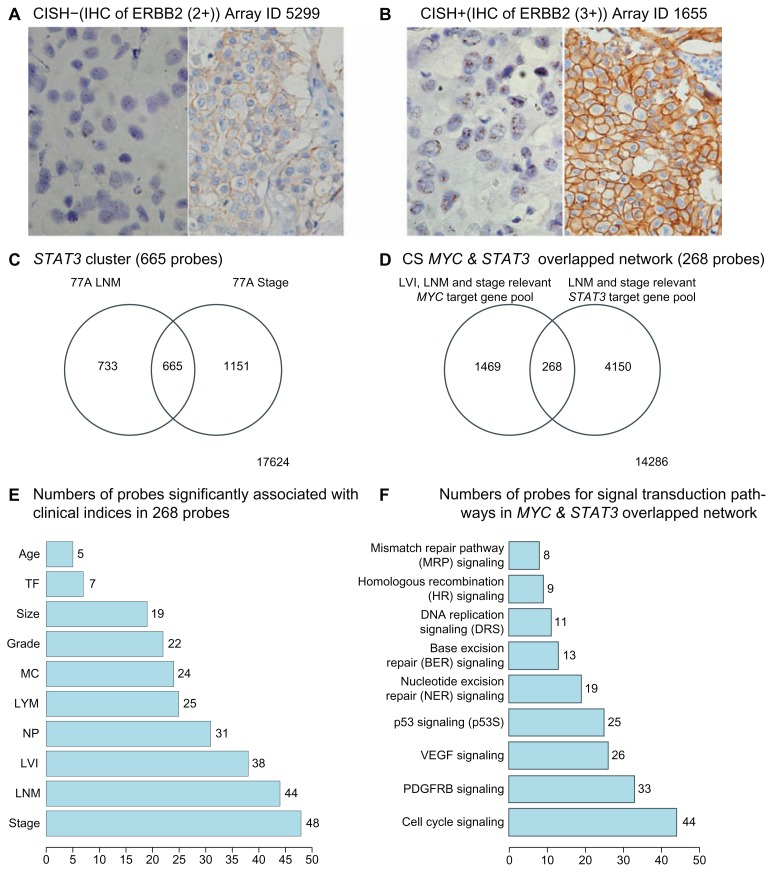
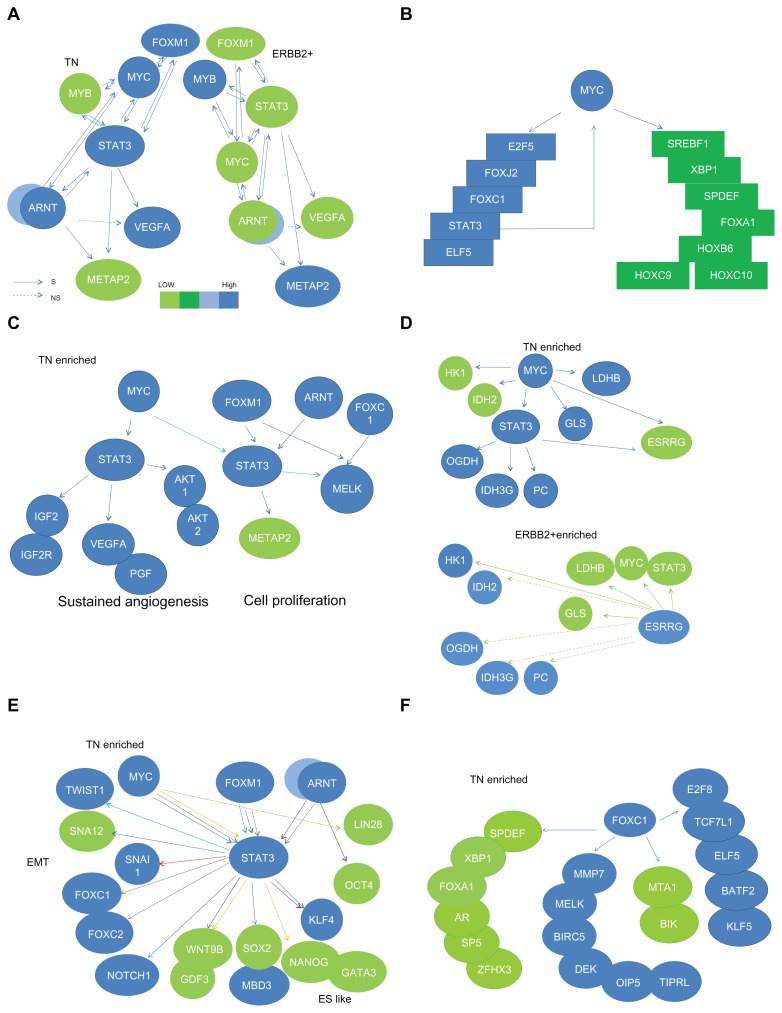
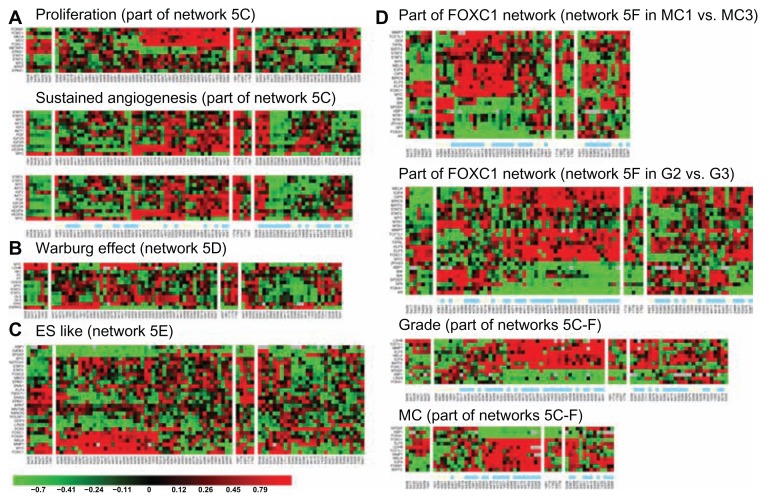
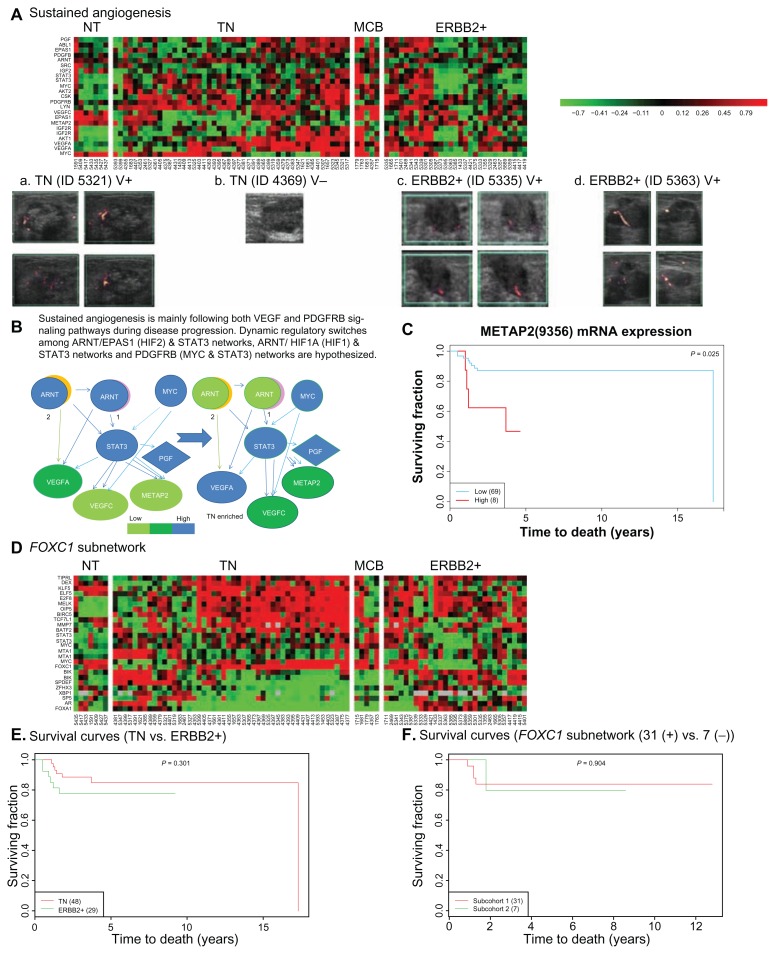
We aimed to find clinically relevant gene activities ruled by the signal transducer and activator of transcription 3 (STAT3) proteins in an ER(-) breast cancer population via network approach. STAT3 is negatively associated with both lymph nodal category and stage. MYC is a component of STAT3 network. MYC and STAT3 may co-regulate gene expressions for Warburg effect, stem cell like phenotype, cell proliferation and angiogenesis. We identified a STAT3 network in silico showing its ability in predicting its target gene expressions primarily for specific tumor subtype, tumor progression, treatment options and prognostic features. The aberrant expressions of MYC and STAT3 are enriched in triple negatives (TN). They promote histological grade, vascularity, metastasis and tumor anti-apoptotic activities. VEGFA, STAT3, FOXM1 and METAP2 are druggable targets. High levels of METAP2, MMP7, IGF2 and IGF2R are unfavorable prognostic factors. STAT3 is an inferred center regulator at early cancer development predominantly in TN.

Keywords: STAT3; grade; microarray; transcriptional regulatory network; vascularity.


Figures

Figure 1
Figure 1
The core methodology of CID-TFUGPCC. A procedure for producing a transcriptional regulatory network of interest in silico via performing the combined method—CIDUGPCC is presented as follows. A selected dataset, which contains gene expression profiles of a population with mixed categories of interest, was chosen for study. The mRNA levels of a selected transcription factor in the given dataset were analyzed by the combined statistical measures (i.e. CID and GPCC) to produce 22 possible sets of results. Before CID measurement, a clustering strategy is applied to divide a pool of data, which contains different mRNA levels of a TF, into several subpools based on the similarity in mRNA expression patterns of the TF within each subpool. Notes: The statistically identified target gene of a TF is determined by either significance (P ≦ 0.05) in CID-TF or in GPCC. “TF” stands for a transcription factor.
Figure 2
Figure 2
The flow chart of steps involved in establishing the transcriptional regulatory network in relation to biochemical phenotypes, malignant phenotypes and clinical outcomes. A self-contained summary of the CID procedure is presented. A major scheme (linked by dark arrows) includes (1) ANOVA test on a TF of interest against seven clinical indices; (2) CID-TFUGPCC analyses on a selected population based on its significant features evaluated by ANOVA; (3) Venn Diagram analysis on the selected gene pools (networks) from the results of step (2); (4) Functional validation of a subnetwork of interest derived from step (3) by its gene expression patterns in different clinical indices, by its prediction in clinicopathological features and by its supporting literature documentation. A side scheme (linked by light arrows) is based on the same dataset but using a different TF to carry on steps (2)–(4).
Figure 3
Figure 3
Upper panel, univariate analyses of STAT3 mRNA levels on seven clinical indices—HER, LVI, lymph nodal category (LYM, LNM), age, tumor size, grade (Nuclear pleomorphism, Mitotic count, Tubule formation) and stage in ER(−) IDCs (A). Two transcript variants (A_a, A_b) are analyzed. Lower panel, univariate analyses of MYC mRNA levels on seven clinical indices in ER(−) IDCs (B). Two transcript variants (B_a, B_b) are analyzed.
Figure 3
Figure 3
Upper panel, univariate analyses of STAT3 mRNA levels on seven clinical indices—HER, LVI, lymph nodal category (LYM, LNM), age, tumor size, grade (Nuclear pleomorphism, Mitotic count, Tubule formation) and stage in ER(−) IDCs (A). Two transcript variants (A_a, A_b) are analyzed. Lower panel, univariate analyses of MYC mRNA levels on seven clinical indices in ER(−) IDCs (B). Two transcript variants (B_a, B_b) are analyzed.
Figure 4
Figure 4
Examples of ERBB2 status determined by results of both CISH (left side picture) and IHC (right side picture) in (A) and (B). Two Venn Diagrams represent the key results from hunting for the main components of STAT3 network. (C) is for gene pools significantly associated with 2 clinical indices (including STAT3, MYC, and ARNT) that include their non- and overlapped genes. (D) is for target gene pools of both MYC and STAT3 networks that are also clinically significant (CS) including their non- and overlapped genes. (E) is a bar chart of probe number within 268 probes to be overlapped with probes in ten clinicopathological parameters, respectively. (F) is a bar chart of probe number within 6,606 probes, which are in MYC and STAT3 overlapped network, for their probes overlapped with probes in nine assigned signal transduction pathways, respectively.
Figure 5
Figure 5
Functional analyses on STAT3 gene partners in TN via (1) Predicted subnetworks derived from genes in STAT3 & MYC overlapped network in both TN and ERBB2+ breast cancer gene expression profiles (A) and key genes in MYC core network of three clinical indices (B); (2) Feature functionalities of major target genes for STAT3 in two STAT3 subnetworks (sustained angiogenesis and cell proliferation) are either commonly co-regulated by MYC and/or differentially co-regulated by FOXM1 or ARNT (C). Those in a STAT3 subnetwork for Warburg effect are co-regulated by ESRRG (D). A subset of genes regulated by multiple combined routes of MYC & STAT3, FOXM1 & STAT3, ARNT/HIF1A & STAT3, ARNT/HIF2A & STAT3 or STAT3 for ES like phenotype (E). A FOXC1 subnetwork (F) is a part of activities for cell proliferation and EMT. Majority components of this subnetwork are significantly associated with mitotic counts. Notes: Solid/dashed lines stand for specific pathway identified as significant/insignificant in gene expression relationship between a TF and a target gene. Each arrow points to its downstream target and only the combined routes toward the same target gene are labeled with the same color.
Figure 6
Figure 6
Heatmaps for subnetworks of MYC & STAT3 differentially coupling with ARNT, FOXM1 in different clinical indices and subtypes of breast cancer. Non-tumor part (NT) serves as a control. Unsupervised gene expression patterns were clustered for subnetworks of three altered biological events (A, B, and C). Networks of MYC & STAT3 in coupling with other transcription factors as well as a FOXC1 subnetwork are observed to functionally promote grade development (D) and sustained angiogenesis (A). The color bar underneath of the heatmap shows beige color for earlier pathological status and light blue color for later pathological status of each denoted clinical index. For instance, at right panel of Figure 6 shows heatmaps for part of FOXC1 network, subnetworks in Figs. 5C–F. At lower panel of Figure 6A, the color bar underneath the heatmaps indicates patients with differential activities of sustained angiogenesis to be not related to their LNM status. Notes: “G2”, “G3” stand for histological grade 2, 3, respectively. “MC1”, “MC3” stand for mitotic count 1, 3, respectively.
Figure 7
Figure 7
Further evaluation on two novel gene sets predicted to be involved in tumor angiogenesis and mitotic count promotion, respectively. Two heatmaps are displayed for subnetworks of MYC & STAT3 differentially coupling with ARNT/HIF1A, ARNT/HIF2A, and FOXC1 in three subtypes of breast cancer (TN, MCB, and ERBB2+) (A, B, and D). Their related clinicopathological phenotype-vascularity (ad) and prognostic features (C, E, and F) are demonstrated. Non-tumor part (NT) is the control. Upper panel shows at least two transcriptional regulatory networks interacting with the center regulator-STAT3 in co-regulating sustained angiogenesis. We pulled genes together based on their activities shared with two signal transduction pathways (i.e. VEGF and PDGFRB in Fig. 4F). Those gene expression levels are shown in the heatmaps (A). A series of in vivo sonographic images (ad) show that tumor vascularity would validate the predicted gene activities shown on the heatmaps (A) for two subtypes (TN and ERBB2+) of ER(−) IDCs. Dissecting those gene activities driven differentially by at least two transcriptional regulatory networks, one diagram of this hypothesis is shown in (B). METAP2 is a component of sustained angiogenesis and is predicted to be a poor prognostic factor (C). “V+” stands for positive vascularity. “V−” stands for negative vascularity. “1” stands for HIF1. “2” stands for HIF2. Lower panel shows a FOXC1 transcriptional regulatory subnetwork enriched in TN but not significant in prognosis. The heatmaps show mRNA levels of probes in FOXC1 subnetwork enriched in TN (D). The subtypic difference between TN and ERBB2+ in their survival probability after surgical removal of tumor is not significant (E). A subset of patients with high activity of FOXC1 subnetwork (subcohort 1) is not significant to be a predictor for poor prognosis in TN when it is compared with low activity one (subcohort 3) (F).

Similar articles

Cited by

References

    1. Chen CJ, You SL, Lin LH, Hsu WL, Yang YW. Cancer epidemiology and control in Taiwan: a brief review. Jpn J Clin Oncol. 2002;32:S66–81. - PubMed
    1. Brown M, Bauer K, Pare M. Tumor marker phenotype concordance in second primary breast cancer, California, 1999–2004. Breast Cancer Res Treat. 2010;120:217–27. - PubMed
    1. Pal SK, Childs BH, Pegram M. Triple negative breast cancer: unmet medical needs. Breast Cancer Res Treat. 2011;125:627–36. - PMC - PubMed
    1. Gonzalez-Angulo AM, Hennessy BT, Mills GB. Future of personalized medicine in oncology: a systems biology approach. J Clin Oncol. 2010;28(16):2777–83. - PMC - PubMed
    1. Chang HH, Dreyfuss JM, Ramoni MF. A transcriptional network signature characterizes lung cancer subtypes. Cancer. 2011;117(2):353–60. - PMC - PubMed