

Correlation between radiographic measures of acetabular morphology with 3D femoral head coverage in patients with acetabular retroversion
- PMID: 22553905
- PMCID: PMC3369147
- DOI: 10.3109/17453674.2012.684138
Correlation between radiographic measures of acetabular morphology with 3D femoral head coverage in patients with acetabular retroversion
Abstract
Background and purpose: Acetabular retroversion may result in anterior acetabular over-coverage and posterior deficiency. It is unclear how standard radiographic measures of retroversion relate to measurements from 3D models, generated from volumetric CT data. We sought to: (1) compare 2D radiographic measurements between patients with acetabular retroversion and normal control subjects, (2) compare 3D measurements of total and regional femoral head coverage between patients and controls, and (3) quantify relationships between radiographic measurements of acetabular retroversion to total and regional coverage of the femoral head.
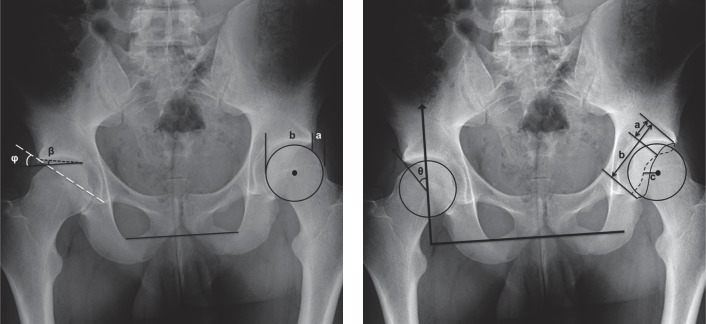
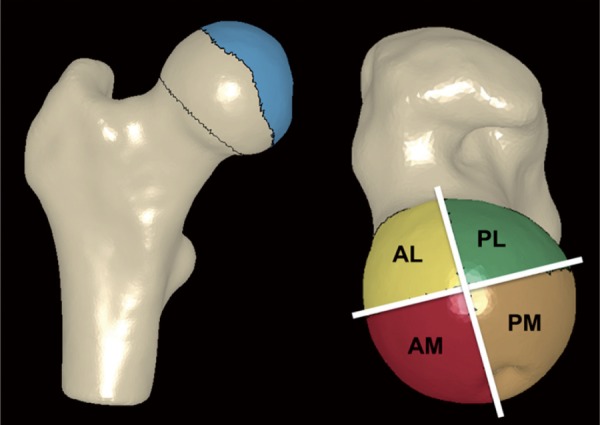
Patients and methods: For 16 patients and 18 controls we measured the extrusion index, crossover ratio, acetabular angle, acetabular index, lateral center edge angle, and a new measurement termed the "posterior wall distance". 3D femoral coverage was determined from volumetric CT data using objectively defined acetabular rim projections, head-neck junctions, and 4 anatomic regions. For radiographic measurements, intra-observer and inter-observer reliabilities were evaluated and associations between 2D radiographic and 3D model-based measures were determined.
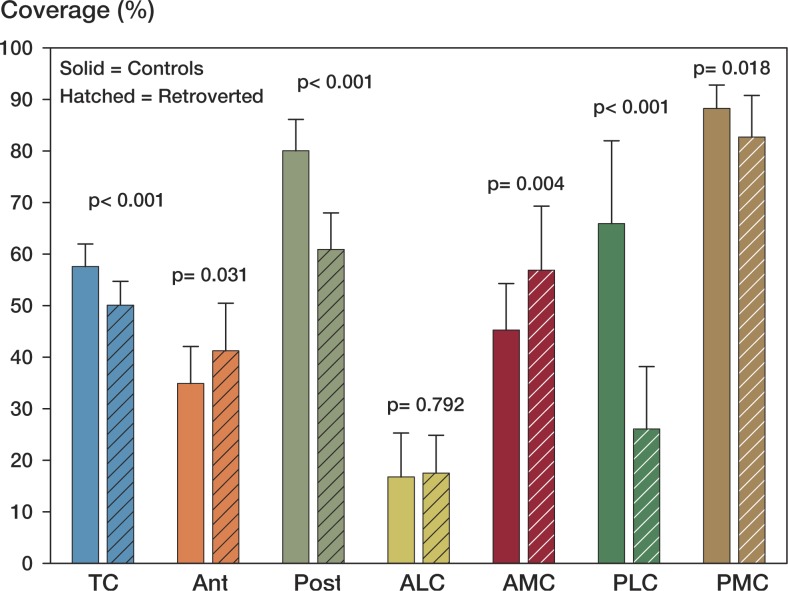
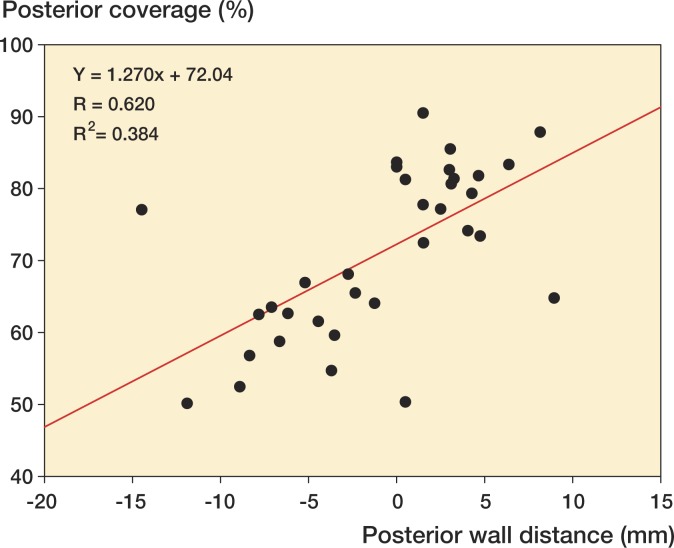
Results: Compared to control subjects, patients with acetabular retroversion had a negative posterior wall distance, increased extrusion index, and smaller lateral center edge angle. Differences in the acetabular index between groups approached statistical significance. The acetabular angle was similar between groups. Acetabular retroversion was associated with a slight but statistically significant increase in anterior acetabular coverage, especially in the anterolateral region. Retroverted hips had substantially less posterior coverage, especially in the posterolateral region.
Interpretation: We found that a number of 2D radiographic measures of acetabular morphology were correlated with 3D model-based measures of total and regional femoral head coverage. These correlations may be used to assist in the diagnosis of retroversion and for preoperative planning.
Figures
References
-
- Anderson AE, Peters CL, Tuttle BD, et al. Subject-specific finite element model of the pelvis: development, validation and sensitivity studies. J Biomech Eng. 2005;127(3):364–73. - PubMed
-
- Banks KP, Grayson DE. Acetabular retroversion as a rare cause of chronic hip pain: recognition of the “figure-eight” sign. Skeletal Radiol (Suppl 1) 2007;36:S108–11. - PubMed
-
- Bardakos NV, Villar RN. Predictors of progression of osteoarthritis in femoroacetabular impingement: a radiological study with a minimum of ten years follow-up. J Bone Joint Surg (Br) 2009;91(2):162–9. - PubMed
-
- Beck M, Kalhor M, Leunig M, et al. Hip morphology influences the pattern of damage to the acetabular cartilage: femoroacetabular impingement as a cause of early osteoarthritis of the hip. J Bone Joint Surg (Br) 2005;87(7):1012–8. - PubMed
Publication types
MeSH terms
Grants and funding
LinkOut - more resources
Full Text Sources