Review
. 2012 Jul;332(2):91-8.
doi: 10.1111/j.1574-6968.2012.02588.x. Epub 2012 May 28.

Modeling microbial community structure and functional diversity across time and space

Affiliations
Review

Modeling microbial community structure and functional diversity across time and space

Peter E Larsen et al. FEMS Microbiol Lett. 2012 Jul.

Abstract

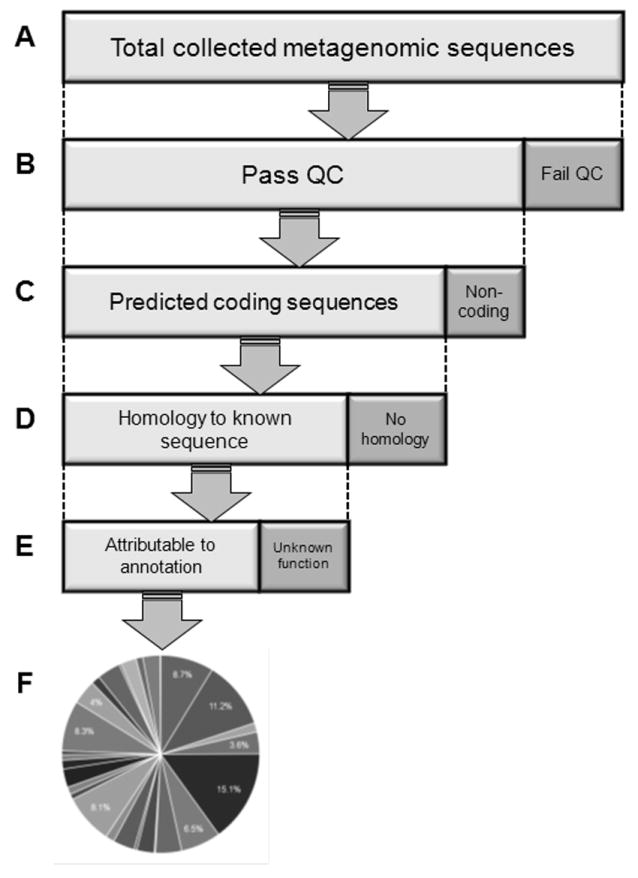
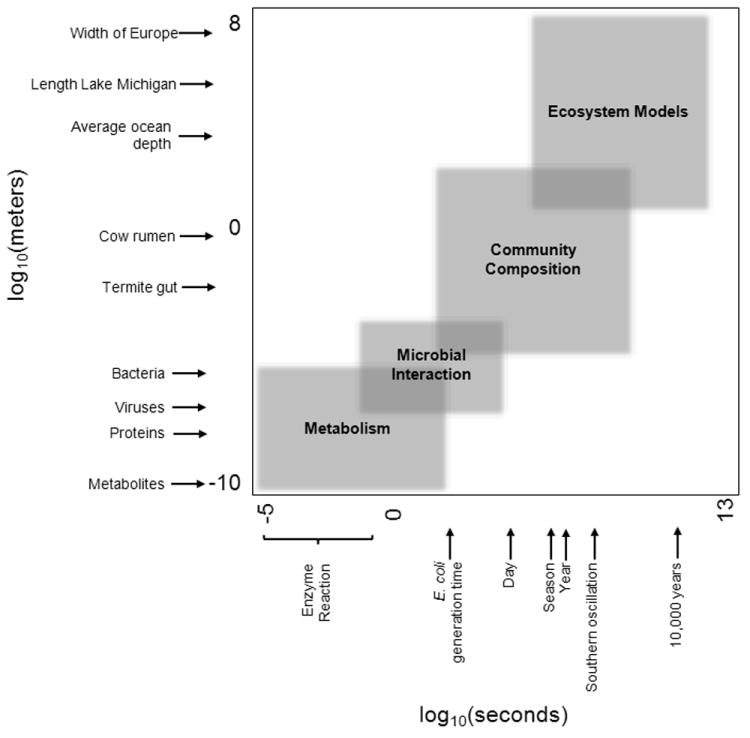
Microbial communities exhibit exquisitely complex structure. Many aspects of this complexity, from the number of species to the total number of interactions, are currently very difficult to examine directly. However, extraordinary efforts are being made to make these systems accessible to scientific investigation. While recent advances in high-throughput sequencing technologies have improved accessibility to the taxonomic and functional diversity of complex communities, monitoring the dynamics of these systems over time and space - using appropriate experimental design - is still expensive. Fortunately, modeling can be used as a lens to focus low-resolution observations of community dynamics to enable mathematical abstractions of functional and taxonomic dynamics across space and time. Here, we review the approaches for modeling bacterial diversity at both the very large and the very small scales at which microbial systems interact with their environments. We show that modeling can help to connect biogeochemical processes to specific microbial metabolic pathways.


Figures

Figure 1
Figure 1. Metagenomic analysis
DNA is extracted directly from a volume of environmental sample. The specific outline featured here is specific to the frequently used MG-RAST metagenomic analysis pipeline (Meyer, et al., 2008), but can be generalized, with variations, to a broad range of metagenomic analysis approaches. (A) The width of this bar represents 100% of the entire DNA sequence data collected from an environmental sample. (B) DNA sequences are subjected to quality control, such as removing sequences that contain ambiguous base calls or are technical duplicates. (C) For sequences that pass quality control, the most likely protein-coding frame is identified. (D) For the predicted protein sequences from sequences that have a likely coding frame, the best homology to proteins in a large database of protein sequences is identified. Given the potentially large number of predicted protein sequences from the metagenomic dataset and the size of the database of known proteins, this step can require considerable computational time. (E) Not every predicted protein that has homology to a known protein will be to a protein of known or predicted function. At the end of metagenomic analysis, only a fraction of initial sequence reads may have generated hits to proteins of known functions or taxonomic identity. (F) Collected annotations, and their relative distributions across metagenomic datasets, are the principle input data for downstream modeling of microbial community structure and function.
Figure 2
Figure 2. Microbial systems at log scale
In this figure, time and physical scales of different categories of microbial interactions are arranged on log 10 scales. Placements of reference points of interest on figure are approximate. Not featured on this figure, time since the origin of microbial life on earth at ~17.1 log10(seconds).

Similar articles

Cited by

References

    1. Ashby MN, Rine J, Mongodin EF, Nelson KE, Dimster-Denk D. Serial analysis of rRNA genes and the unexpected dominance of rare members of microbial communities. Appl Envir Microbiol. 2007;73:4532–4542. - PMC - PubMed
    1. Barberan A, Bates ST, Casamayor EO, Fierer N. Using network analysis to explore co-occurrence patterns in soil microbial communities. ISME J. 2012;6:343–351. - PMC - PubMed
    1. Bardgett RD, Freeman C, Ostle NJ. Microbial contributions to climate change through carbon cycle feedbacks. ISME J. 2008;2:805–814. - PubMed
    1. Barns SM, Fundyga RE, Jeffries MW, Pace NR. Remarkable archaeal diversity detected in a Yellowstone National Park hot spring environment. Proc Natl Acad Sci USA. 1994;91:1609–1613. - PMC - PubMed
    1. Baune C, Bottcher ME. Experimental investigation of sulphur isotope partitioning during outgassing of hydrogen sulphide from diluted aqueous solutions and seawater. Isotopes in Env and Health Stud. 2010;46:444–453. - PubMed

Publication types