. 2012 Jun 15;7(6):1040-8.
doi: 10.1021/cb300028a. Epub 2012 May 3.

Selective identification of hedgehog pathway antagonists by direct analysis of smoothened ciliary translocation

Affiliations

Selective identification of hedgehog pathway antagonists by direct analysis of smoothened ciliary translocation

Yu Wang et al. ACS Chem Biol. .

Abstract

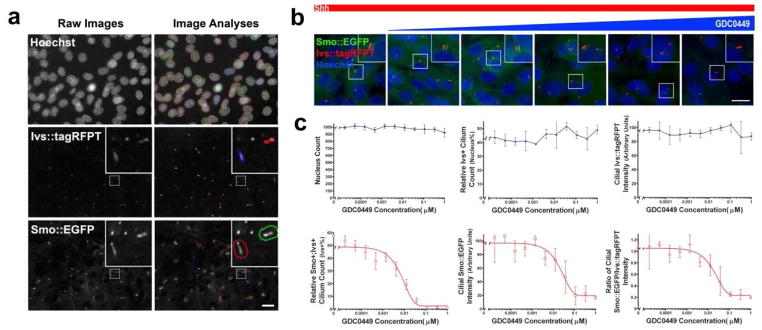
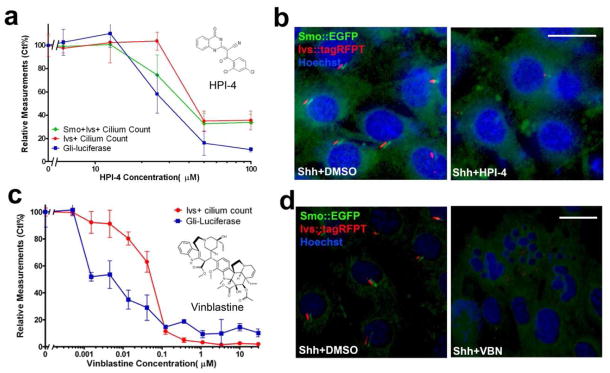
Hedgehog (Hh) signaling promotes tumorigenesis. The accumulation of the membrane protein Smoothened (Smo) within the primary cilium (PC) is a key event in Hh signal transduction, and many pharmacological inhibitors identified to date target Smo's actions. Smo ciliary translocation is inhibited by some pathway antagonists, while others promote ciliary accumulation, an outcome that can lead to a hypersensitive state on renewal of Hh signaling. To identify novel inhibitory compounds acting on the critical mechanistic transition of Smo accumulation, we established a high content screen to directly analyze Smo ciliary translocation. Screening thousands of compounds from annotated libraries of approved drugs and other agents, we identified several new classes of compounds that block Sonic hedgehog-driven Smo localization within the PC. Selective analysis was conducted on two classes of Smo antagonists. One of these, DY131, appears to inhibit Smo signaling through a common binding site shared by previously reported Smo agonists and antagonists. Antagonism by this class of compound is competed by high doses of Smo-binding agonists such as SAG and impaired by a mutation that generates a ligand-independent, oncogenic form of Smo (SmoM2). In contrast, a second antagonist of Smo accumulation within the PC, SMANT, was less sensitive to SAG-mediated competition and inhibited SmoM2 at concentrations similar to those that inhibit wild-type Smo. Our observations identify important differences among Hh antagonists and the potential for development of novel therapeutic approaches against mutant forms of Smo that are resistant to current therapeutic strategies.


Figures

Fig. 1
Fig. 1
A high content Smo antagonist screen - image analysis and assay validation.(a) A field of cells in a typical well. The cell number was calculated by counting Hoechst stained nuclei. The PC were precisely segmented as Ivs::tagRFPT positive structures and hSmo::EGFP intensity was quantified in the PC. (b) Representative images of the dose-dependent inhibition of Smo::EGFP ciliary accumulation by GDC0449. The concentrations of GDC0449 used to obtain these images were 0, 0.15nM, 1.3nM, 12nM, 111nM, 1μM from left to right. Scale bar: 10μm. (c) Key measurements from high content image analyses. The cell number was determined by counting Hoechst stained nuclei. Ivs::tagRFPT positive structures were precisely segmented as the PC and Smo::EGFP intensity within the PC was quantified. The Ivs+ cilium count and Smo+ cilium count were determined based on arbitrary thresholds; the mean (±S.D) shown is based on four replicates.
Fig. 2
Fig. 2
Identification of compounds disrupting the PC. (a–b) HPI-4, an inhibitor of ciliogenesis, was identified in the assay. Please note that, throughout this paper, Ctrl% is an additional normalization over the mean of DMSO (with or without Shh) treatment as 100%, unless stated otherwise, such as “Ctl=1”.(c–d) Vinblastine (VBN), which disrupts microtubules, and leads to disruption of the PC, was also identified through general effects on Ivs::tagRFPt; the mean (±S.D) for the Smo localization assay and Gli-luciferase transcriptional reporter assays was calculated from four replicates (a and c). HPI-4 and VBN were used at 50μM and 370nM, respectively, to generate the representative images in (b) and (d). Scale bar: 10μm.
Fig. 3
Fig. 3
DY131 displays a conserved mechanism for Smo inhibition similar with previously identified antagonists. (a) Structure of DY131 and GSK4716. (b–c) Representative images (b) and quantification (c) of DY131 and GSK4716 inhibition of Hh induced Smo accumulation at the primary cilium. 500nM SANT-1 was used as a positive controlfor pronounced inhibition. DY131 and GSK4716 were used at 3.75μM and 7.5μM, respectively, for data in (b). Scale bar: 5μm. (d) Gli-luciferase measurements indicate dose-dependent inhibition of Hh pathway activity by both DY131 and GSK4716. Data show the means (±S.D.) from quadruplicate samples. Image analysis was based on over 300 cells per sample. (e) Representative images showing Smo::EGFP and SmoM2::EGFP overexpressing cells treated with vehicle or 1.1μM DY131. Scale bar: 5μm. (f) Image analysis of quadruplicate samples, plotting mean (±S.D.) of over 300 cells analyzed in each sample. (g) Dose-response curves displaying DY131 inhibition of wild-type Smo, and SmoM2 activity. Data show mean (±S.D.) in quadruplicate samples. Representative images (h) and quantification (i) of Bodipy-Cyc competition experiments. Cyc, SANT-1, and DY131 were each used at 1.1 μM in (h). Scale bar: 10μm. Data show the mean (±S.D.) in quadruplicate samples (i), analyzing 50–100 transfected cells in each sample.
Fig. 4
Fig. 4
SMANT displays an unprecedented mechanism for Smo inhibition. (a) Structure of SMANT and SMANT-2. (b–c) Representative images (b) and quantification (c) of SMANT and SMANT-2 inhibition of Hh induced Smo accumulation at the primary cilium. 1μM SANT-2 was used as a positive control. SMANT and SMANT-2 were used at 7.5μM for data in (b). Scale bar: 5μm. (d) Representative images showing Smo::EGFP and SmoM2::EGFP overexpressing cells treated with vehicle or SMANT. SMANT was applied to wild-type Smo and SmoM2 expressing cells at 7.5μM and 30μM respectively. Scale bar: 5μm. (e) Image analysis of quadruplicate samples shown in (d), plotting mean (±S.D.) of over 300 cells analyzed in each sample. (f–g) Representative images (f) and quantifications of Smociliary localization (g) showing Smo::EGFP/Ivs::tagRFPT cells treated with 100nM SAG combined with vehicle, SANT-1, GDC0449, or SMANT. SANT-1, GDC0449 and SMANT were used at 1μM, 120nM, and 60μM. (h) Gli-luciferase measurement of dose-dependent inhibition of Hh pathway activity by SMANT upon Shh stimulation, overexpression of Smo and SmoM2 respectively, or treatment with 0.2 μM or 1μM of SAG. Data show the means (±S.D.) from triplicate samples. (i) Gli-luciferase measurements in suFU−/− mouse embryonic fibroblasts treated with DY131 and SMANT respectively. GDC0449 and GANT61 were used as negative and positive controls respectively. (j–k) Representative images (j) and quantification (k) of Bodipy-Cyc competition experiments for SMANT. SANT-1 served as a control for competition activity. SMANT was used at 30 μM in (h). Scale bar: 5μm. Data show the mean (±S.D.) from quadruplicate samples (i), analyzing 100–200 transfected cells in each sample.
Fig. 5
Fig. 5
DY131 and SMANT inhibit proliferation of cerebellar granule-cell neural progenitors (CGNP) without conferring hypersensitivity to Shh stimulation. (a–b) representative images (a) and quantification of phospho-histone H3 (pH3) positive cells (b) upon co-treatment with 0.625μM DY131 or SMANT with Shh ligand. (b) P<=0.001 in t-test for all samples treated with DY131 or SMANT at 0.625μM and above compared with DMSO treated controls. (c–e) In contrast to Cyc, GDC0449, DY131, and SMANT do not confer prolonged hypersensitivity to Shh stimulation in either Gli responsive reporter (c) or CGNP proliferation assays (d–e). Hh signaling activity and CGNP proliferation were measured after treatment with vehicle, Cyc (5μM), GDC0449 (500nM), DY131 (10μM), or SMANT (10μM) separately. Samples were analyzed in quadruplicate; data show the mean (±S.D.). For the Gli-luciferase reporter assay (c), cells stimulated by Shh for a relatively short time period (12 hours) displayed a modest but significant inductive response (#p<0.003 in a t test comparing to a DMSO primed 0 nM Shh treatment). The response was enhanced by pre-treating cells with Cyc (##P<0.003 in t test comparing to DMSO priming and stimulation with the same concentration of Shh) whereas pretreatment with GDC0449, DY131, or SMANT showed no enhancing activity (P>0.05 in t test comparing samples primed with DMSO and stimulated with the same concentration of Shh). For the CGNP assay (d–e), cells were treated for 3 days. +p<0.0001 in a t test comparing the effects of DMSO (control) or any of the antagonists of Smo ciliary accumulation.

Similar articles

Cited by

References

    1. McMahon AP, Ingham PW, Tabin CJ. Developmental roles and clinical significance of hedgehog signaling. Curr Top Dev Biol. 2003;53:1–114. - PubMed
    1. Xie J, Murone M, Luoh SM, Ryan A, Gu Q, Zhang C, Bonifas JM, Lam CW, Hynes M, Goddard A, Rosenthal A, Epstein EH, Jr, de Sauvage FJ. Activating Smoothened mutations in sporadic basal-cell carcinoma. Nature. 1998;391:90–92. - PubMed
    1. Romer JT, Kimura H, Magdaleno S, Sasai K, Fuller C, Baines H, Connelly M, Stewart CF, Gould S, Rubin LL, Curran T. Suppression of the Shh pathway using a small molecule inhibitor eliminates medulloblastoma in Ptc1 (+/−) p53 (−/−) mice. Cancer Cell. 2004;6:229–240. - PubMed
    1. Yauch RL, Gould SE, Scales SJ, Tang T, Tian H, Ahn CP, Marshall D, Fu L, Januario T, Kallop D, Nannini-Pepe M, Kotkow K, Marsters JC, Rubin LL, de Sauvage FJ. A paracrine requirement for hedgehog signalling in cancer. Nature. 2008;455:406–410. - PubMed
    1. Rubin LL, de Sauvage FJ. Targeting the Hedgehog pathway in cancer. Nature Reviews Drug Discovery. 2006;5:1026–1033. - PubMed

Publication types