. 2012 Jun;11(3):210-9.

Small-animal imaging using clinical positron emission tomography/computed tomography and super-resolution

Affiliations

Small-animal imaging using clinical positron emission tomography/computed tomography and super-resolution

Frank P DiFilippo et al. Mol Imaging. 2012 Jun.

Abstract

Considering the high cost of dedicated small-animal positron emission tomography/computed tomography (PET/CT), an acceptable alternative in many situations might be clinical PET/CT. However, spatial resolution and image quality are of concern. The utility of clinical PET/CT for small-animal research and image quality improvements from super-resolution (spatial subsampling) were investigated. National Electrical Manufacturers Association (NEMA) NU 4 phantom and mouse data were acquired with a clinical PET/CT scanner, as both conventional static and stepped scans. Static scans were reconstructed with and without point spread function (PSF) modeling. Stepped images were postprocessed with iterative deconvolution to produce super-resolution images. Image quality was markedly improved using the super-resolution technique, avoiding certain artifacts produced by PSF modeling. The 2 mm rod of the NU 4 phantom was visualized with high contrast, and the major structures of the mouse were well resolved. Although not a perfect substitute for a state-of-the-art small-animal PET/CT scanner, a clinical PET/CT scanner with super-resolution produces acceptable small-animal image quality for many preclinical research studies.


Figures

Figure 1
Figure 1
Apparatus for stepped PET acquisition. A small bed holding the phantom or animal is attached to three motorized linear stages are arranged in orthogonal directions (X,Y,Z). The entire apparatus is placed on the patient table of the clinical PET/CT scanner so that the phantom or animal is centered in the scanner field of view. The clinical scanner acquires CT images first and then moves the table to the rear of the gantry for the stepped PET acquisition.
Figure 2
Figure 2
Images of the NEMA NU 4 phantom obtained with the clinical PET/CT scanner: rod transaxial slice (top row), cylinder transaxial slice (middle row), and coronal slice (bottom row). The PET images (first three columns) show varying degrees of resolution, contrast, and Gibbs ringing artifact depending on the method. Corresponding CT images are shown in the right column.
Figure 3
Figure 3
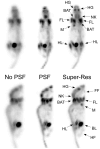
Transaxial slices of a 28 g mouse injected with FDG were reconstructed from the static PET data without (first row “No PSF”) and with (second row “PSF”) point spread function (PSF) modeling using the clinical workstation. The super-resolution images (third row “Super-Res”) were produced from the stepped PET data using iterative deconvolution post-reconstruction. The corresponding CT slices (fourth row) also are shown. Brightness and contrast were adjusted per PET image for optimal display. The super-resolution images consistently show improved image quality and resolve structures not visible in the no PSF or PSF images. Structures are identified and labeled as follows: brain (BR), front feet (FF), brown adipose tissue (BAT), muscles of the front legs (FL), myocardium (M), bowel uptake (BW), paraspinal muscles (PS), bladder (BL), and muscles of the hind legs (HL).
Figure 4
Figure 4
Maximum intensity projection images of a 28 g mouse injected with FDG, illustrating improved reconstruction using the super-resolution method (“Super-Res”) compared to the available reconstructions on the clinical workstation (“No PSF” and “PSF”). Structures are identified and labeled as follows: harderian glands (HG), neck uptake (NK), brown adipose tissue (BAT), muscles of the front legs (FL), front feet (FF), myocardium (M), bladder (BL), muscles of the hind legs (HL), and hind feet (HF).
Figure 5
Figure 5
Recovery coefficients versus rod diameter of the NU 4 phantom as measured from the super-resolution images, in comparison with published values in the literature as measured from various dedicated small-animal PET scanners (References: 31–35).

Similar articles

Cited by

References

    1. Chatziioannou AF. Molecular imaging of small animals with dedicated PET tomographs. Eur J Nucl Med Mol Imaging. 2002;29:98–114. - PubMed
    1. Vanderheyden JL. The use of imaging in preclinical drug development. Q J Nucl Med Mol Imaging. 2009;53:374–81. - PubMed
    1. de Kemp RA, Epstein FH, Catana C, Tsui BM, Ritman EL. Small-animal molecular imaging methods. J Nucl Med. 2010;51:18S–32S. - PMC - PubMed
    1. Chatziioannou AF. PET scanners dedicated to molecular imaging of small animal models. Mol Imaging Biol. 2002;4:47–63. - PubMed
    1. Levin CS, Zaidi H. Current trends in preclinical PET system design. PET Clin. 2007;2:125–60. - PubMed

Publication types