Review
. 2012 Aug;22(4):709-16.
doi: 10.1016/j.conb.2012.04.001. Epub 2012 May 1.

Neural processing of gustatory information in insular circuits

Affiliations
Review

Neural processing of gustatory information in insular circuits

Arianna Maffei et al. Curr Opin Neurobiol. 2012 Aug.

Abstract

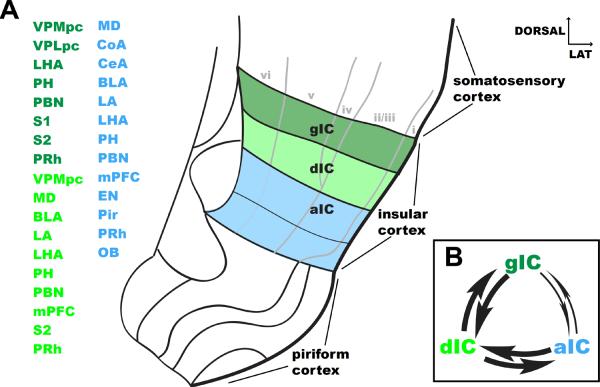
The insular cortex is the primary cortical site devoted to taste processing. A large body of evidence is available for how insular neurons respond to gustatory stimulation in both anesthetized and behaving animals. Most of the reports describe broadly tuned neurons that are involved in processing the chemosensory, physiological and psychological aspects of gustatory experience. However little is known about how these neural responses map onto insular circuits. Particularly mysterious is the functional role of the three subdivisions of the insular cortex: the granular, the dysgranular and the agranular insular cortices. In this article we review data on the organization of the local and long-distance circuits in the three subdivisions. The functional significance of these results is discussed in light of the latest electrophysiological data. A view of the insular cortex as a functionally integrated system devoted to processing gustatory, multimodal, cognitive and affective information is proposed.


Figures

Figure 1
Figure 1. Summary of long-distance and local connections of the insular cortex in the rat
A. Coronal view of the region of the rat's brain containing the somatosensory cortex, the insular cortex and the piriform cortex. The three subdivisions of the insular cortex and the input areas are color coded: dark green corresponds to the granular insular cortex, light green to the dysgranular insular cortex and light blue to the agranular insular cortex. Overlaid in grey on the coronal view is a schematic outline of the cortical layers. The semi-transparent line between L5 and L6 in agranular insular cortex indicates the fading boundary between these two layers. Abbreviations: aIC: agranular insular cortex, BLA: basolateral amygdala, CeA: central amygdala, CoA: anterior cortical nucleus, dIC: dysgranular insular cortex, EN: endopiriform nucleus, gIC: granular insular cortex, LA: lateral amygdala, LHA: lateral hypothalamic area, MD: mediodorsal thalamic nucleus, mPFC: medial prefrontal cortex, OB: olfactory bulb, PBN: parabrachial nucleus, PH: posterior hypothalamic nucleus, Pir: piriform cortex, PRh: perirhinal cortex, S1: somatosensory cortex, area 1, S2: somatosensory cortex area 2, VPLpc: ventroposterolateral thalamic nucleus, parvicellular part, VPMpc: ventroposteromedial thalamic nucleus, parvicellular part. The numbers next to the afferent area indicate the references. B. Schematic of the feed-forward, feed-back interconnectivity between gIC, dIC and aIC. The smaller arrows connecting gIC with aIC reflect the sparser connection between these two areas.
Figure 2
Figure 2. Neural responses in the insular cortex
A. Hot spots of neurons narrowly tuned to specific taste qualities in the gustatory region of the insular cortex. Top. Diagram of the location of GC (yellow region) in the rodent brain. MCA: middle cerebral artery; RV: rhinal veins; LOT: lateral olfactory tract. Scale bar: 1 mm. Bottom. Diagram of GC indicating four hot spots each containing about 30% of neurons that are narrowly tuned for one specific taste quality (red: bitter; green: sweet; orange: salty; yellow: umami). The representations for each quality appear spatially segregated. Scale bar: 0.5 mm. B. Overlap and plasticity of taste maps. Top. Map of the region of insular cortex activated by four taste qualities: bitter (red), sweet (green), salty (orange) and sour (light blue). The maps show a large spatial overlap between qualities. Bottom. Plasticity of taste maps following aversive conditioning of sucrose. Left: baseline maps of the regions activated by bitter (red) and sweet (green) stimuli. Middle: regions activated by bitter and sweet stimuli following aversive conditioning to sucrose. Note the increase in overlap between sucrose and quinine representations. Right: restoration of the original map following extinction of the aversive memory. Scale bar: 0.5 mm. C. Cues activated taste responsive neurons in the gustatory portion of rodent insular cortex. Left. Double labeling of neurons in the gustatory cortex using two immediate early genes (H1a: red; c-fos: green). Neurons were double labeled with H1a and c-fos allowing for the identification of populations of neurons that were activated by two stimuli delivered at successive time points (epoch 1 E1 or epoch 2 E2). Right. Bar plot representing the proportion of neurons double labeled in response to: exposure to the same tastant (black), exposure to a predictive cue and the predicted tastant (white); exposure to a non-predictive cue and a tastant (grey). Note that the predictive cue activates the same population of neurons that were activated by the stimulus associated with the cue. D. Anticipatory firing in gustatory cortex. Top. Population peri-stimulus time histogram (PSTH) of gustatory cortical neurons in response to tastants self-administered following an auditory cue. Time = 0 corresponds to the time of self-delivery. Note the ramp of anticipatory activity preceding self-administration. Shading around the trace indicates the standard error of the mean. Bottom. Raster plots (above) and PSTHs (below) of two neurons in response to anticipatory cues. Time = 0 corresponds to the onset of the auditory cue. The left panel depicts a neuron with an excitatory response to the cue, the right panel shows a neuron with an inhibitory response. Blue diamonds indicate the timing of self-delivery. Panels were taken and modified from A: [*12]; B: [42]; C: [**57] and D: [**60].

References

    1. Penfield W, Jasper HH. Epilepsy and the functional anatomy of the human brain. edn [1st Little; Boston: 1954.
    1. Motta G. I fattori centrali delle disgeusie. Tipografia Luigi Parma; Bologna: 1958.
    1. Gallay DS, Gallay MN, Jeanmonod D, Rouiller EM, Morel A. The insula of reil revisited: multiarchitectonic organization in macaque monkeys. Cereb Cortex. 2012;22:175–190. - PMC - PubMed
    1. Allen GV, Saper CB, Hurley KM, Cechetto DF. Organization of visceral and limbic connections in the insular cortex of the rat. J Comp Neurol. 1991;311:1–16. - PubMed
    1. Saper CB. Convergence of autonomic and limbic connections in the insular cortex of the rat. J Comp Neurol. 1982;210:163–173. - PubMed

Publication types