

Effects of the fungicide metiram in outdoor freshwater microcosms: responses of invertebrates, primary producers and microbes
- PMID: 22555811
- PMCID: PMC3377896
- DOI: 10.1007/s10646-012-0909-0
Effects of the fungicide metiram in outdoor freshwater microcosms: responses of invertebrates, primary producers and microbes
Abstract
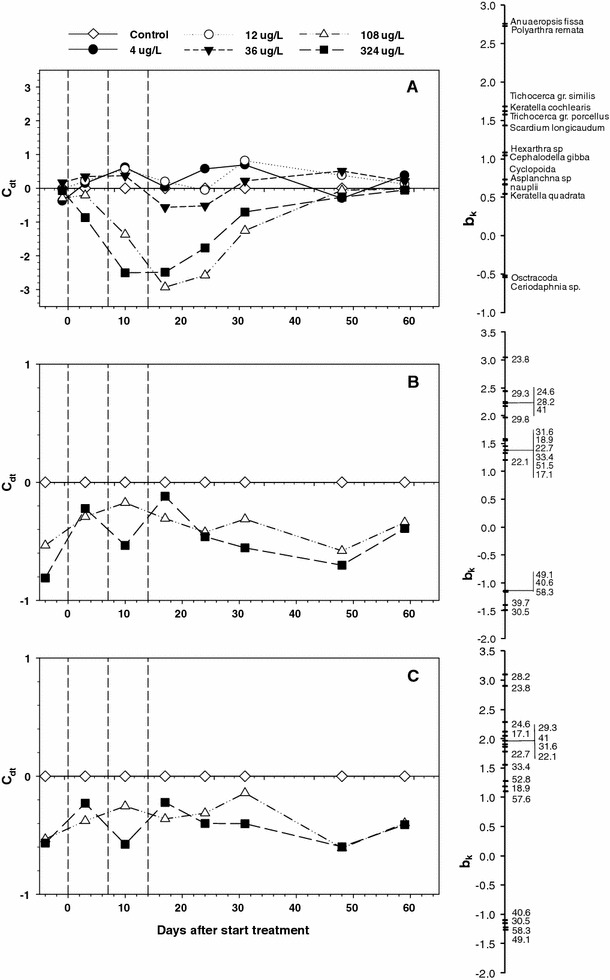
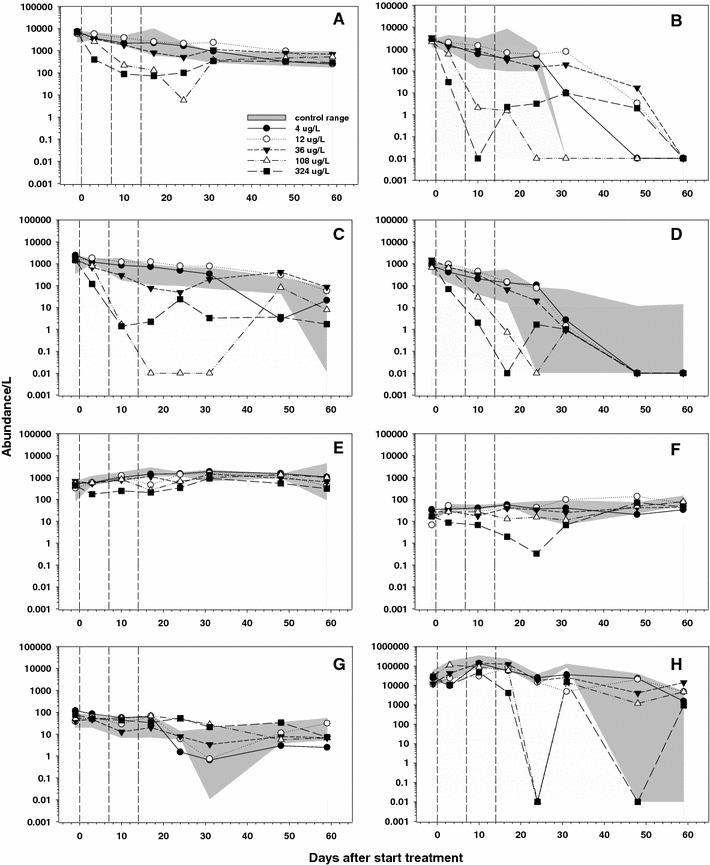
The ecological impact of the dithiocarbamate fungicide metiram was studied in outdoor freshwater microcosms, consisting of 14 enclosures placed in an experimental ditch. The microcosms were treated three times (interval 7 days) with the formulated product BAS 222 28F (Polyram®). Intended metiram concentrations in the overlying water were 0, 4, 12, 36, 108 and 324 μg a.i./L. Responses of zooplankton, macroinvertebrates, phytoplankton, macrophytes, microbes and community metabolism endpoints were investigated. Dissipation half-life (DT₅₀) of metiram was approximately 1-6 h in the water column of the microcosm test system and the metabolites formed were not persistent. Multivariate analysis indicated treatment-related effects on the zooplankton (NOEC(community) = 36 μg a.i./L). Consistent treatment-related effects on the phytoplankton and macroinvertebrate communities and on the sediment microbial community could not be demonstrated or were minor. There was no evidence that metiram affected the biomass, abundance or functioning of aquatic hyphomycetes on decomposing alder leaves. The most sensitive populations in the microcosms comprised representatives of Rotifera with a NOEC of 12 μg a.i./L on isolated sampling days and a NOEC of 36 μg a.i./L on consecutive samplings. At the highest treatment-level populations of Copepoda (zooplankton) and the blue-green alga Anabaena (phytoplankton) also showed a short-term decline on consecutive sampling days (NOEC = 108 μg a.i./L). Indirect effects in the form of short-term increases in the abundance of a few macroinvertebrate and several phytoplankton taxa were also observed. The overall community and population level no-observed-effect concentration (NOEC(microcosm)) was 12-36 μg a.i./L. At higher treatment levels, including the test systems that received the highest dose, ecological recovery of affected measurement endpoints was fast (effect period < 8 weeks).
Figures


Similar articles
-
Exposure and effects of sediment-spiked fludioxonil on macroinvertebrates and zooplankton in outdoor aquatic microcosms.Sci Total Environ. 2018 Jan 1;610-611:1222-1238. doi: 10.1016/j.scitotenv.2017.08.155. Epub 2017 Aug 30. Sci Total Environ. 2018. PMID: 28851143
-
Direct and indirect effects of the fungicide Carbendazim in tropical freshwater microcosms.Arch Environ Contam Toxicol. 2010 Feb;58(2):315-24. doi: 10.1007/s00244-009-9367-y. Epub 2009 Jul 29. Arch Environ Contam Toxicol. 2010. PMID: 19639239
-
Ecological impacts of time-variable exposure regimes to the fungicide azoxystrobin on freshwater communities in outdoor microcosms.Ecotoxicology. 2012 May;21(4):1024-38. doi: 10.1007/s10646-012-0856-9. Epub 2012 Jan 26. Ecotoxicology. 2012. PMID: 22278367 Free PMC article.
-
Current trends and mismatches on fungicide use and assessment of the ecological effects in freshwater ecosystems.Environ Pollut. 2024 Apr 15;347:123678. doi: 10.1016/j.envpol.2024.123678. Epub 2024 Mar 5. Environ Pollut. 2024. PMID: 38447649 Review.
-
Genotoxic effects of marine pollutants on coastal meso-zooplankton populations - A mini-review.Mar Pollut Bull. 2024 Aug;205:116548. doi: 10.1016/j.marpolbul.2024.116548. Epub 2024 Jun 27. Mar Pollut Bull. 2024. PMID: 38941804 Review.
Cited by
-
Relationship between land use pattern and the structure and diversity of soil meso-micro arthropod community.Ecotoxicology. 2014 May;23(4):707-17. doi: 10.1007/s10646-014-1186-x. Epub 2014 Jan 28. Ecotoxicology. 2014. PMID: 24468921
-
Spatial variation of phytoplankton community structure in Daya Bay, China.Ecotoxicology. 2015 Oct;24(7-8):1450-8. doi: 10.1007/s10646-015-1471-3. Epub 2015 May 9. Ecotoxicology. 2015. PMID: 25956980
-
Fungicides: An Overlooked Pesticide Class?Environ Sci Technol. 2019 Apr 2;53(7):3347-3365. doi: 10.1021/acs.est.8b04392. Epub 2019 Mar 18. Environ Sci Technol. 2019. PMID: 30835448 Free PMC article.
-
Effect of thiram and of a hydrocarbon mixture on freshwater macroinvertebrate communities in outdoor stream and pond mesocosms: II. Biological and ecological trait responses and leaf litter breakdown.Ecotoxicology. 2015 Nov;24(9):1933-46. doi: 10.1007/s10646-015-1531-8. Epub 2015 Aug 27. Ecotoxicology. 2015. PMID: 26311171
-
Indirect Effect of Pesticides on Insects and Other Arthropods.Toxics. 2021 Jul 30;9(8):177. doi: 10.3390/toxics9080177. Toxics. 2021. PMID: 34437495 Free PMC article. Review.
References
-
- Baird DJ, Brock TCM, De Ruiter PC, Boxall ABA, Culp JM, Eldridge P, Hommen U, Jak RG, Kidd KA, Dewitt T. The food web approach in the environmental management of toxic substances. In: Baird DJ, Burton GA, editors. Ecological variability: separating natural from anthropogenic causes of ecosystem impairment. Pensacola: SETAC Press; 2001. pp. 83–122.
Publication types
MeSH terms
Substances
LinkOut - more resources
Full Text Sources
