

The significance of education for mortality compression in the United States
- PMID: 22556045
- PMCID: PMC3500099
- DOI: 10.1007/s13524-012-0104-1
The significance of education for mortality compression in the United States
Abstract
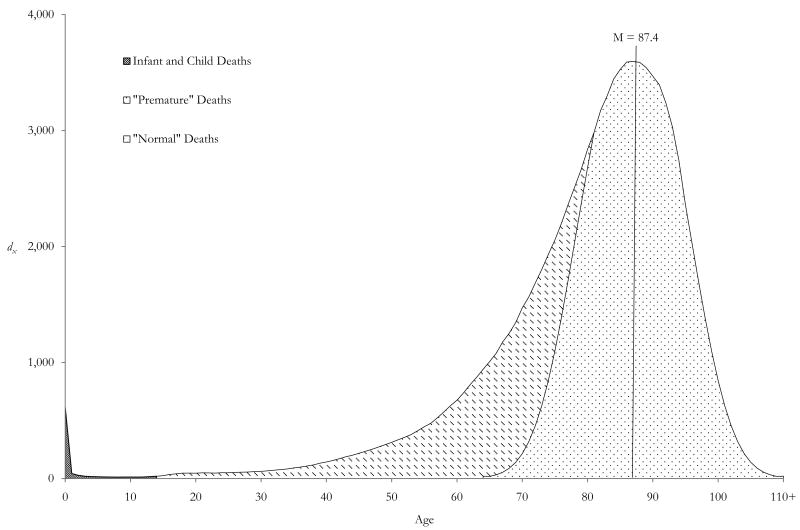
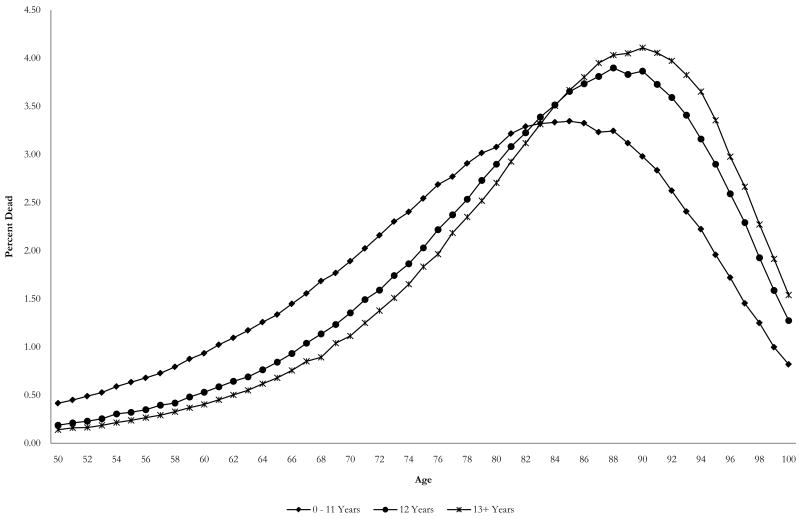
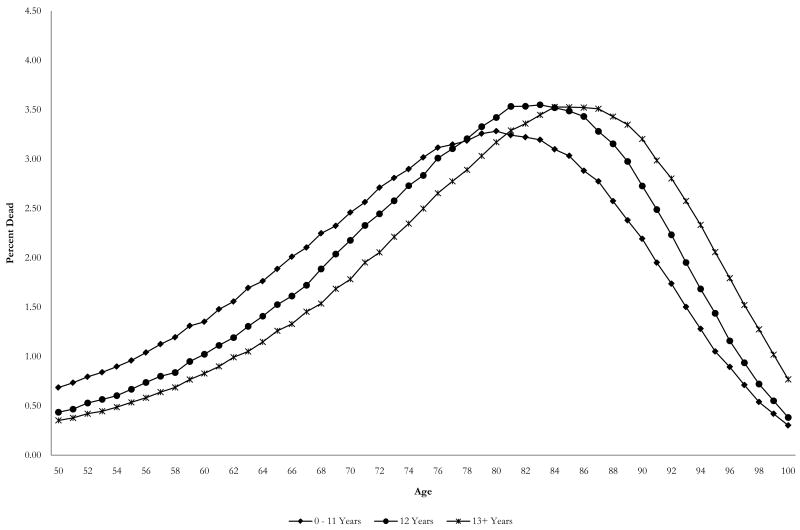
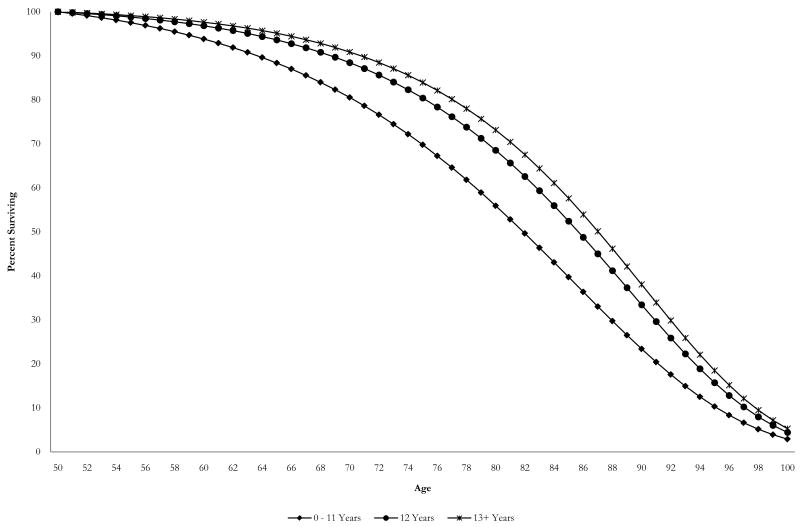
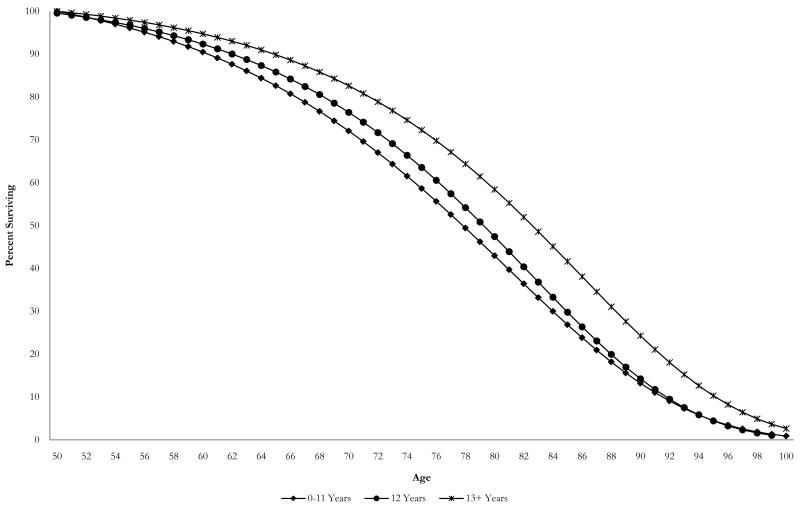
Recent studies of old-age mortality trends assess whether longevity improvements over time are linked to increasing compression of mortality at advanced ages. The historical backdrop of these studies is the long-term improvement in a population's socioeconomic resources that fueled longevity gains. We extend this line of inquiry by examining whether socioeconomic differences in longevity within a population are accompanied by old-age mortality compression. Specifically, we document educational differences in longevity and mortality compression for older men and women in the United States. Drawing on the fundamental cause of disease framework, we hypothesize that both longevity and compression increase with higher levels of education and that women with the highest levels of education will exhibit the greatest degree of longevity and compression. Results based on the Health and Retirement Study and the National Health Interview Survey Linked Mortality File confirm a strong educational gradient in both longevity and mortality compression. We also find that mortality is more compressed within educational groups among women than men. The results suggest that educational attainment in the United States maximizes life chances by delaying the biological aging process.
Figures
References
-
- Bongaarts J. Long-Range Trends in Adult Mortality: Models and Projection Methods. Demography. 2005;42(1):23–49. - PubMed
-
- Bongaarts J, Feeney G. How Long Do We Live? Population Development Review. 2002;28(1):13–29.
-
- Cai L, Lubitz J, Hayward M, Saito Y, Hagedorn A, Crimmins E. Estimation of Multi-State Life Table Functions and their Variability from Complex Survey Data Using the SPACE Program. Demographic Research 22:129-158. 2010 Available online at http://www.demographic-research.org/Volumes/Vol22/6/22-6.pdf. - PMC - PubMed
-
- Canudas-Romo V. The Modal Age at Death and the Shifting Mortality Hypothesis. Demographic Research. 2008;19(30):1179–1204. Available online at http://www.demographic-research.org/Volumes/Vol19/30/19-30.pdf.
Publication types
MeSH terms
Grants and funding
LinkOut - more resources
Full Text Sources
