. 2012 Jun 5;109(23):E1481-8.
doi: 10.1073/pnas.1200781109. Epub 2012 May 3.

Molecular architecture of chemoreceptor arrays revealed by cryoelectron tomography of Escherichia coli minicells

Affiliations

Molecular architecture of chemoreceptor arrays revealed by cryoelectron tomography of Escherichia coli minicells

Jun Liu et al. Proc Natl Acad Sci U S A. .

Abstract

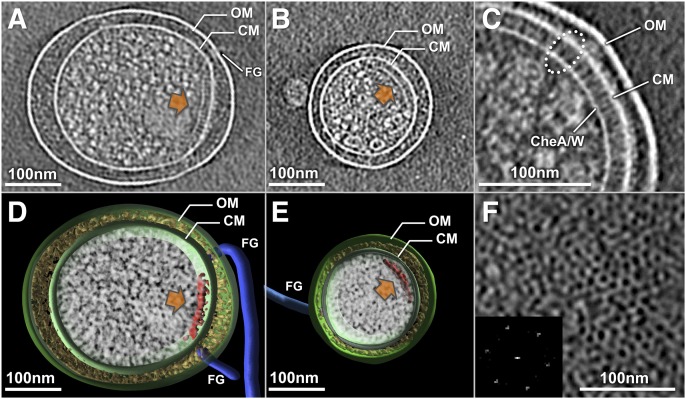
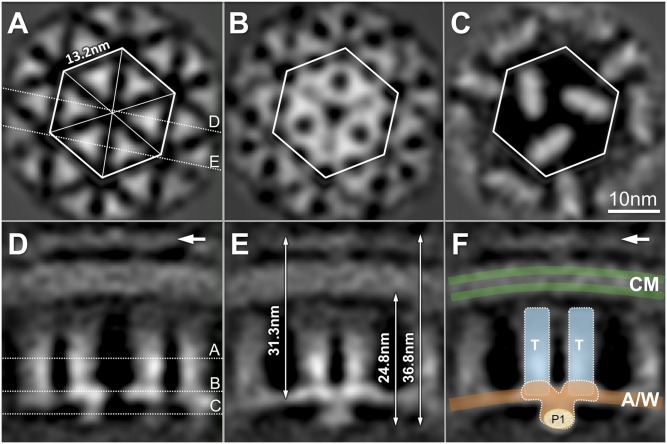
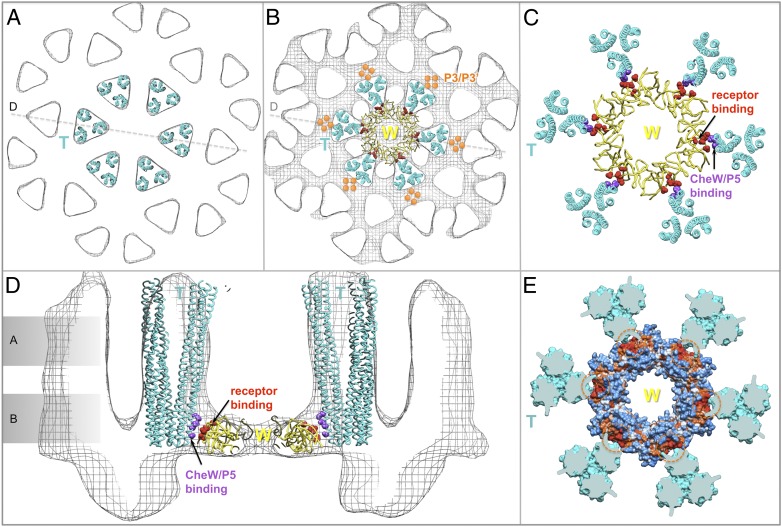
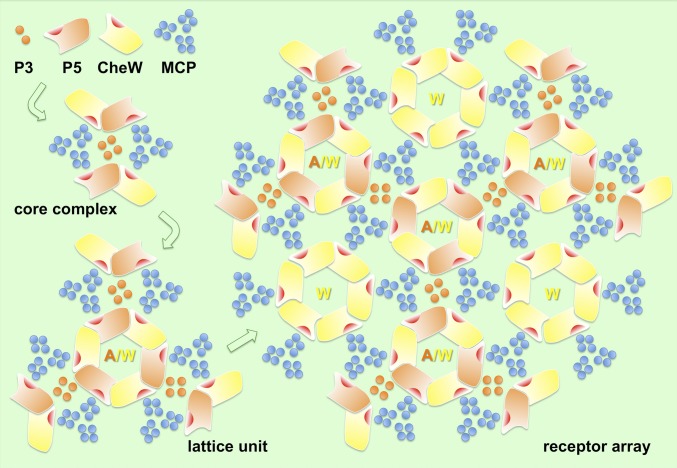
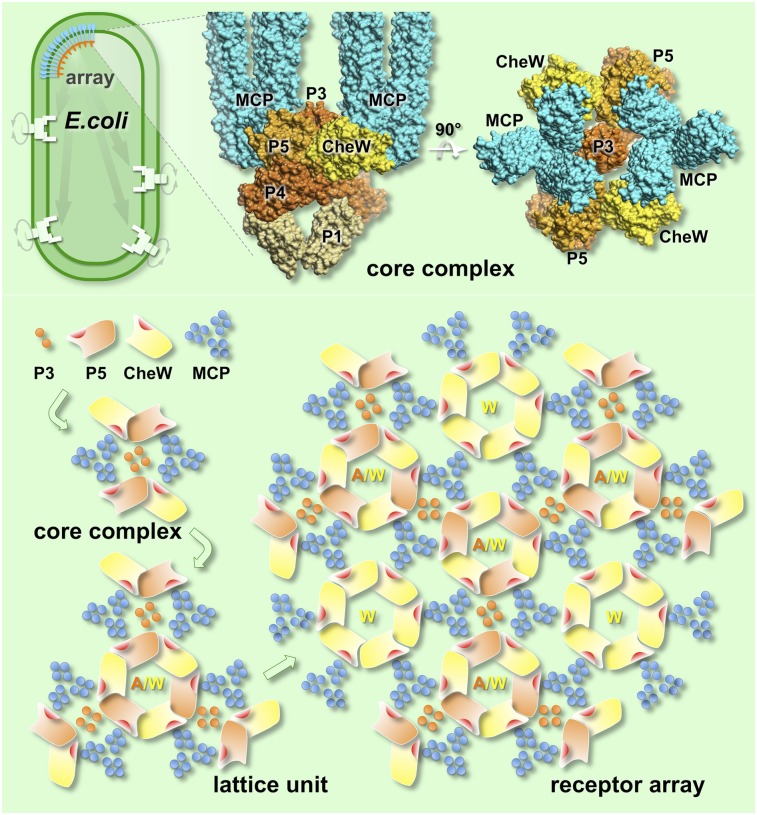
The chemoreceptors of Escherichia coli localize to the cell poles and form a highly ordered array in concert with the CheA kinase and the CheW coupling factor. However, a high-resolution structure of the array has been lacking, and the molecular basis of array assembly has thus remained elusive. Here, we use cryoelectron tomography of flagellated E. coli minicells to derive a 3D map of the intact array. Docking of high-resolution structures into the 3D map provides a model of the core signaling complex, in which a CheA/CheW dimer bridges two adjacent receptor trimers via multiple hydrophobic interactions. A further, hitherto unknown, hydrophobic interaction between CheW and the homologous P5 domain of CheA in an adjacent core complex connects the complexes into an extended array. This architecture provides a structural basis for array formation and could explain the high sensitivity and cooperativity of chemotaxis signaling in E. coli.


Conflict of interest statement

The authors declare no conflict of interest.

Figures

Fig. 1.
Fig. 1.
Cryo-ET of E. coli minicells reveals receptor arrays. (A and B) Central slices of tomographic reconstructions show that the receptor arrays (orange arrows) in typical minicells varied from 200–400 nm in size. (D and E) Corresponding 3D models were generated by manually segmenting the outer membrane (OM; green), cytoplasmic membrane (CM; green), flagella (FG; blue), and receptor arrays (red). Electron densities in the cytoplasm and periplasmic space are shown in white and yellow, respectively. (C) In a zoom-in side view, the periplasmic domain, cytoplasmic domain of the MCPs, and CheA-CheW basal layer are readily discernible. (F) Top view of the receptor array and a power spectrum (Inset) reveal the hexagonal lattice.
Fig. 2.
Fig. 2.
The 3D map of receptor arrays derived from subvolume analysis. (AC) Three transverse slices parallel to the membrane were taken at the positions shown in a cross-section perpendicular to the membrane. (A) Hexagonal lattice with 13.2-nm spacing contains six triangular densities, corresponding to the expected location of the MCP trimers. The distance between the centers of two adjacent triangular densities is 7.5 nm, and their flat surfaces face each other. (B) Pattern at the transverse slice across the CheA-CheW basal layer reveals complex densities that bridge between neighboring trimers. (C) At the membrane distal surface, three elongated densities predominate and presumably correspond to P1 and P4 domains of CheA dimers. (D and E) In slices perpendicular to the membrane, which are denoted in A, the pillar-like MCP densities are evident. White arrows indicate a density layer consistent with the periplasmic domains of the receptors. (E) Two densities merge together at the distal end of neighboring trimers. The total distance from the apex of the periplasmic domain to the distal end of the receptor array is 36.8 nm, whereas the distal end is 24.8 nm from the surface of the inner leaflet of the cytoplasmic membrane. A continuous-density layer at the distal end of the trimers is visible 31.3 nm away from the apex of the periplasmic domain. (F) Cartoon model of the MCP trimers (T; cyan), CheA/CheW layer (A/W; orange), and cytoplasmic membrane (CM; green) is overlaid onto the electron density map. (Scale bar: 10 nm.)
Fig. 3.
Fig. 3.
Molecular architecture of the MCP/CheW/CheA core complex and the entire receptor array, formed by docking the atomic structures onto the Cryo-ET density map. A core complex with a stoichiometry of 6:2:1 (6 MCP dimers and 2 CheW monomers for each CheA dimer) was constructed by computationally fitting the atomic structures of individual components into the density map from Fig. 2. (A and D) Six structures of the Tsr trimer (residues 300–480; labeled as a cyan T) fit well into the map. (AC) Progressive slices through the core complex (indicated in D), moving away from the membrane into the cytoplasm, are shown. (A) Four Tsr dimers face each other and form the interface between two adjacent trimers. At level c, only the P1 and P4 domains of CheA are well-resolved, with P2 apparently being too unstructured to provide a coherent density. (D) Cytoplasmic tips of the Tsr trimers are shown embedded into the density layer corresponding to CheA/CheW. Two Tsr trimers, outlined in A, belong to one complex (rendered as ribbons); they join together with one CheA dimer and two CheW (W) monomers in B and C. (B and E) Composite model of the CheA/CheW complex is placed between two cytoplasmic tips of two Tsr trimers, and the P3 domain of CheA is aligned roughly parallel to them. Residues I33, E38, I39, and V87 of CheW, which are critical for receptor binding, are shown in red. The red residues in the P5 domain of CheA are presumptive receptor-binding determinants, based on homology to CheW. The hydrophobic core of the Tsr trimer and hydrophobic residues connecting a Tsr dimer to P5 or CheW are highlighted in purple and/or indicated by a purple dashed circle. (E) These hydrophobic pockets are also shown as orange residues encircled by orange dashes in the hydrophobicity surface model at the top, with hydrophilic residues shown in blue and hydrophobic residues in orange. Both P5 and CheW can interact simultaneously with two different Tsr dimers to form a core complex. (E and F) Two adjacent core complexes are connected by a previously undescribed interaction between P5 and CheW. Three P5/CheW complexes form a ring. Subdomain-2 of CheW and subdomain-1 of P5 are critical for the CheW/P5 interaction (orange arrows), as is observed in the crystal structure of P4/P5/CheW (16). Residues D521, G629, V607, K616, A622, L633, and I634 from P5 and residues V45, T46, T51, K56, I65, M156, and L158 from CheW are colored in orange and yellow, respectively. Subdomain-2 of P5 is adjacent to subdomain-1 from the adjacent CheW. In F, a cyan arrow points to a second interface between P5 and CheW. Some residue substitutions at R555 (green) impair the in vivo chemotactic function of CheA (22). Several hydrophobic residues (L542, L545 and L552; cyan) are also located at this interface.
Fig. 4.
Fig. 4.
CheW-only ring in the receptor array. (A and D) Six Tsr trimers (residues 300–480; labeled as a cyan T) were fitted into the map as a rigid body. (A and B) Progressive slices through the core complex in D, moving into the cytoplasm and away from the membrane, are shown. (B and C) Six CheW (W) molecules form a ring that is structurally similar to the CheW/P5 ring (Fig. 3) but lacks additional density beneath the CheW-only ring (d). Each CheW interacts with one dimer subunit of a Tsr trimer, which is free to form a core complex with an adjacent MCP trimer, and a P3/P3′ dimer serves as the central core. (C and D) At the interface between one Tsr trimer and one CheW monomer, residues I33, E38, I39, and V87 of CheW (colored in red) form a hydrophobic pocket (orange dashed circles) adjacent to hydrophobic residues (F373, I377, L380, and V384; purple) from Tsr. (E) Same residues from different Tsr monomers that form the hydrophobic core of the Tsr trimer (purple dashed circles in Fig. 3E) are shown in orange and highlighted with orange dashed circles in the hydrophobicity map of the CheW ring.
Fig. 5.
Fig. 5.
Cartoon illustrates the assembly of an extended receptor array. The initial components, consisting of the P3 and P5 domains of CheA (orange), MCP trimers (blue), and CheW (yellow) form a core complex. Three core complexes are interconnected by P5/CheW interactions to form a lattice unit, which can assemble further to form an indefinitely large array. Rings containing only CheW may play a role in reinforcing the network to achieve optimal cooperativity and sensitivity.
Fig. P1.
Fig. P1.
Highly cooperative receptor array in E. coli is responsible for the sensitivity, high dynamic range, and strong amplification of chemotactic signaling, which regulates the direction of the flagellar rotation (Upper Left). Cryo-ET of intact receptor arrays in E. coli minicells not only reveals the molecular architecture of the MCP-CheW-CheA core signaling complex (composed of 6 MCP dimers and 2 CheW monomers for each CheA dimer) (Upper Center and Upper Right) but provides insights into a molecular basis of the array formation from its key components (Lower).

References

    1. Sourjik V, Armitage JP. Spatial organization in bacterial chemotaxis. EMBO J. 2010;29:2724–2733. - PMC - PubMed
    1. Hazelbauer GL, Falke JJ, Parkinson JS. Bacterial chemoreceptors: High-performance signaling in networked arrays. Trends Biochem Sci. 2008;33(1):9–19. - PMC - PubMed
    1. Briegel A, et al. Universal architecture of bacterial chemoreceptor arrays. Proc Natl Acad Sci USA. 2009;106:17181–17186. - PMC - PubMed
    1. Maddock JR, Shapiro L. Polar location of the chemoreceptor complex in the Escherichia coli cell. Science. 1993;259:1717–1723. - PubMed
    1. Bray D, Levin MD, Morton-Firth CJ. Receptor clustering as a cellular mechanism to control sensitivity. Nature. 1998;393:85–88. - PubMed

Publication types

MeSH terms

LinkOut - more resources