. 2012 Sep;11(9):558-70.
doi: 10.1074/mcp.M112.017004. Epub 2012 May 3.

Life and death of proteins: a case study of glucose-starved Staphylococcus aureus

Affiliations

Life and death of proteins: a case study of glucose-starved Staphylococcus aureus

Stephan Michalik et al. Mol Cell Proteomics. 2012 Sep.

Abstract

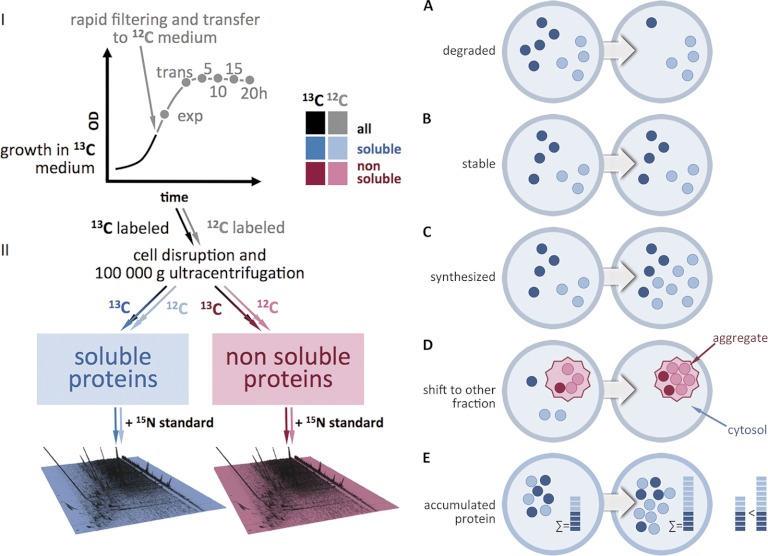
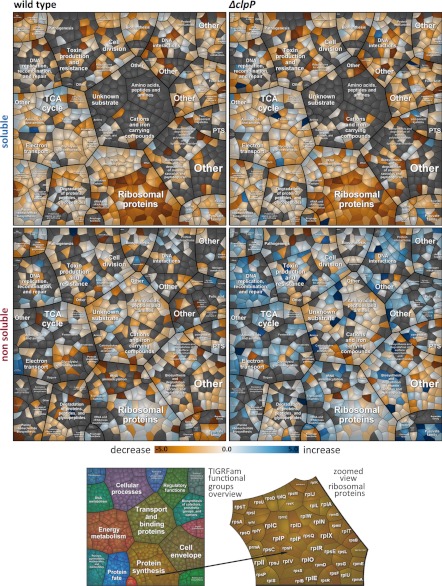
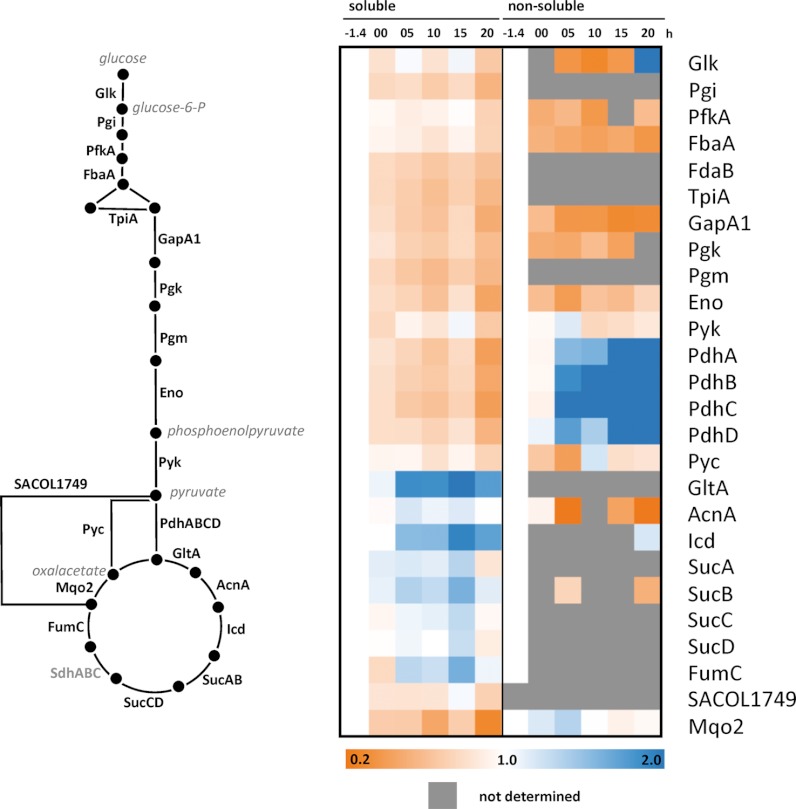
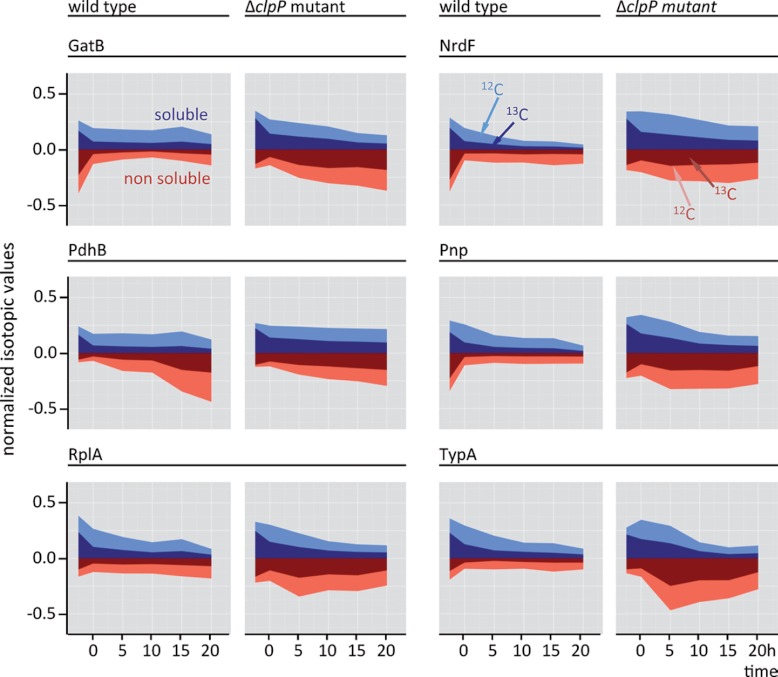
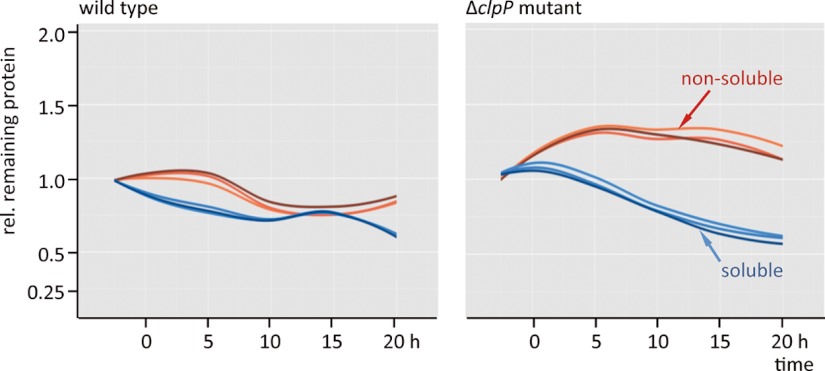
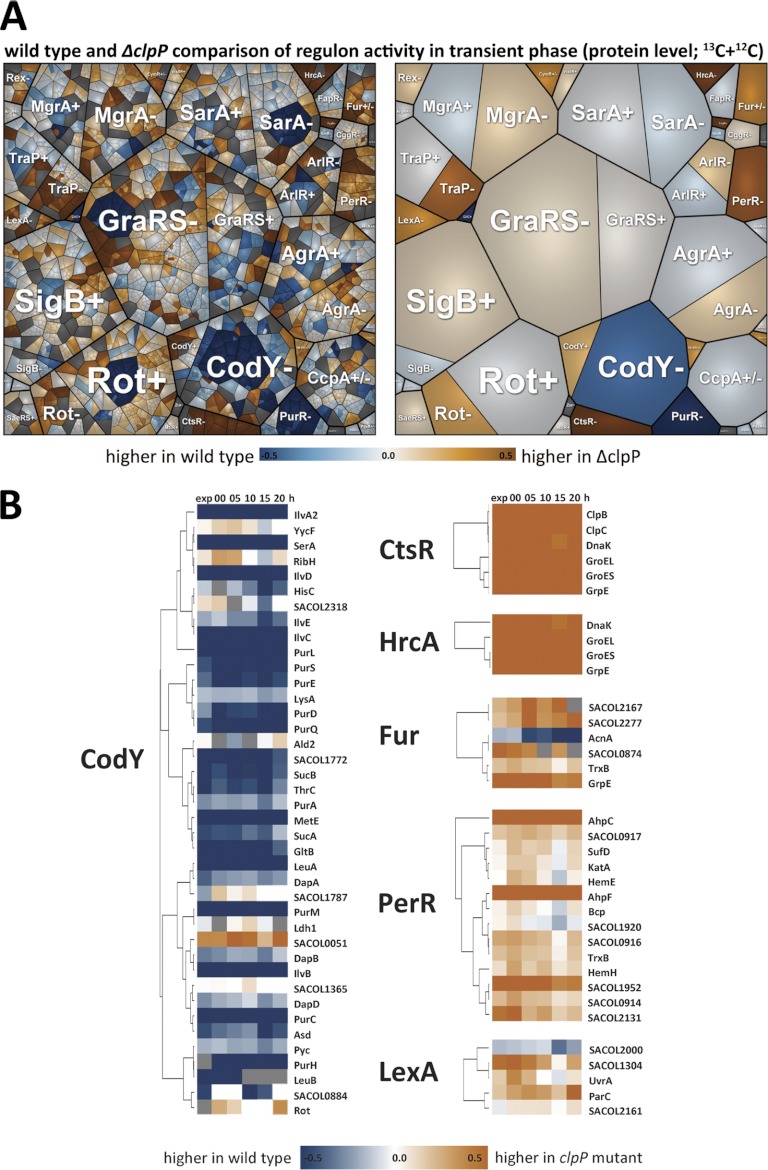
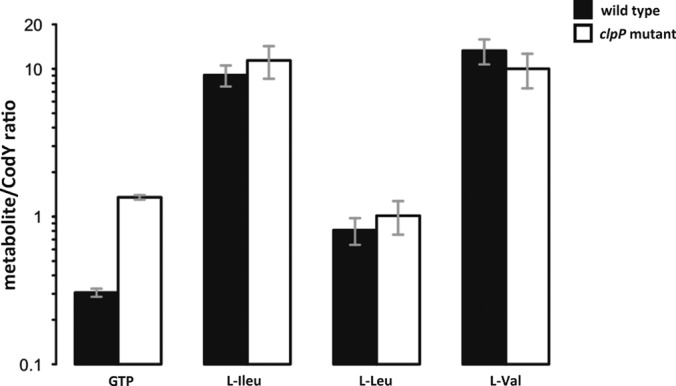
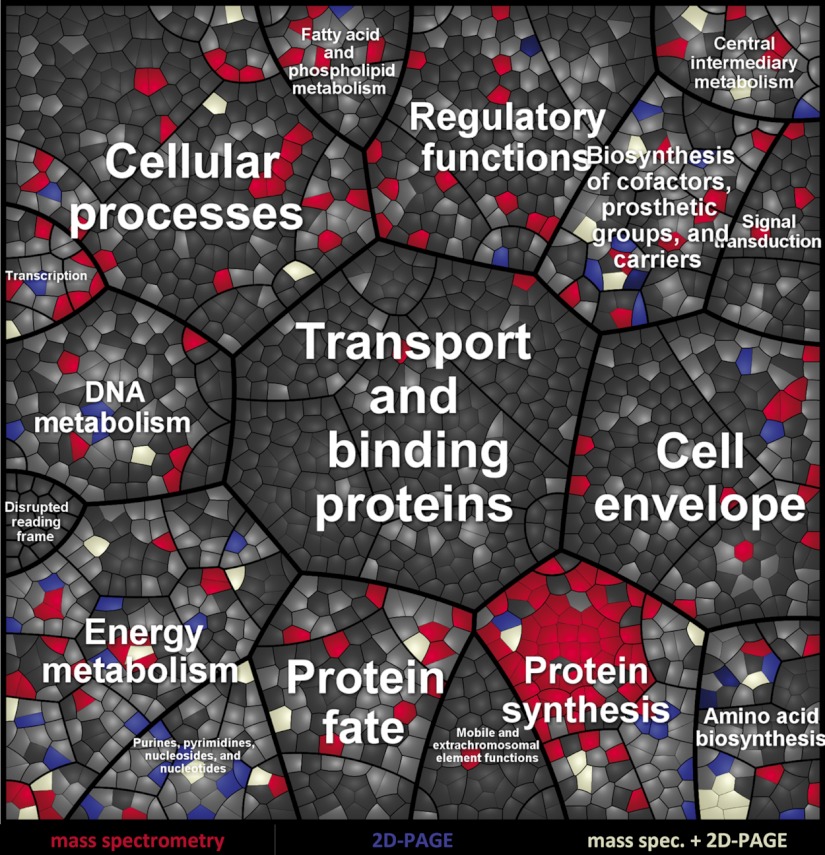
The cellular amount of proteins not only depends on synthesis but also on degradation. Here, we expand the understanding of differential protein levels by complementing synthesis data with a proteome-wide, mass spectrometry-based stable isotope labeling with amino acids in cell culture analysis of protein degradation in the human pathogen Staphylococcus aureus during glucose starvation. Monitoring protein stability profiles in a wild type and an isogenic clpP protease mutant revealed that 1) proteolysis mainly affected proteins with vegetative functions, anabolic and selected catabolic enzymes, whereas the expression of TCA cycle and gluconeogenesis enzymes increased; 2) most proteins were prone to aggregation in the clpP mutant; 3) the absence of ClpP correlated with protein denaturation and oxidative stress responses, deregulation of virulence factors and a CodY repression. We suggest that degradation of redundant, inactive proteins disintegrated from functional complexes and thereby amenable to proteolytic attack is a fundamental cellular process in all organisms to regain nutrients and guarantee protein homeostasis.


Figures

Fig. 1.
Fig. 1.
Schematic presentation of the experimental procedure and the possible events that can be observed. A, protein degradation; B, protein stabilization; C, protein de novo synthesis; D, protein shift from the soluble into the non-soluble cell fraction; E, accumulation of 13C and 12C species protein species.
Fig. 2.
Fig. 2.
Treemaps visualize an increase and a decrease of proteins in the wild type and clpP mutant for the soluble as well as the nonsoluble fraction. The linear slope was calculated for each protein out of the log10 13C/15N - values corrected against isotopic protein dilution because of growth and normalized against the initial 13C/15N-value for each fraction [valuetx=log10((C13/N15)tx(C13/N15)t1×Ncells,txNcells,t1)]. Proteins were clustered according to their functional categories (e.g. protein synthesis). Orange colors designate a decrease, blue colors an increase and whitish colors stable proteins. Gray polygons indicate undetermined proteins.
Fig. 3.
Fig. 3.
Degradation kinetics of selected proteins involved in glycolysis and TCC depicted as heatmap for soluble and nonsoluble fraction (13C/15N - values corrected against isotopic protein dilution because of growth and normalized against the initial 13C/15N-value for each fraction; valuetx=(C13/N15)tx(C13/N15)t1×Ncells,txNcells,t1). Glycolytic enzymes were slightly degraded, whereas most of the TCA cycle enzymes were stabilized or shifted into the nonsoluble fraction (e.g.. PdhABCD).
Fig. 4.
Fig. 4.
The proportion of 13C and 12C isotopic forms of selected proteins is depicted for the wild type and the clpP mutant in the soluble and nonsoluble fraction; (exp. growth phase, transient phase (0 h), 5 h, 10 h, 15 h, and 20 h of stationary phase). The isotopic proportions of the soluble and nonsoluble fraction were calculated by normalization against the sum of all isotopic values for each protein in a fraction (valueC13,solublefractiontx=(C13/N15)txi=16(C13/N15+C12/N15)ti;valueC12,solublefractiontx=(C12/N15)txi=16(C13/N15+C12/N15)ti;valueC13,nonsolublefractiontx=(C13/N15)txi=16(C13/N15+C12/N15)ti;valueC12,nonsolublefractiontx=(C12/N15)txi=16(C13/N15+C12/N15)ti).
Fig. 5.
Fig. 5.
Loess-fit curves over all 13C-remaining protein values (13C/15N - values corrected against isotopic protein dilution because of growth and normalized against the initial 13C/15N-value for each fraction; valuetx=(C13/N15)tx(C13/N15)t1×Ncells,txNcells,t1) reveal the protein stability in the soluble (blue) and in the nonsoluble fraction (red) of the wild type and the clpP mutant. The different reds and blues correspond to the three biological replicates.
Fig. 6.
Fig. 6.
A, A Voronoi treemap of clustered regulons. Values reflect protein accumulation ratios [ratio=log10((C13/N15)ΔclpP+(C12/N15)ΔclpP(C13/N15)wildtype+(C12/N15)wildtype)] from the wild type and the clpP mutant during transient growth. ± indicates positive or negative control by the regulator. B, The protein accumulation ratios (log10) from selected proteins are depicted for the CodY-, CtsR-, HrcA-, Fur-, PerR-, and LexA-regulon. Blue indicates stronger accumulation in the wild type and dark orange indicates stronger accumulation in the clpP mutant.
Fig. 7.
Fig. 7.
The amount of intracellular GTP, l-isoleucine, l-leucine, and l-valine in the exponential growth phase was normalized to the total amount of CodY protein.
Fig. 8.
Fig. 8.
A Treemap is shown for the comparison of results obtained by two-dimensional-PAGE and mass spectrometry. Proteins detected in the soluble fraction in the wild type are colored in light gray; proteins solely found by mass spectrometry to be diminished below 50% are colored in red; proteins solely detected by two-dimensional-PAGE to be diminished below 50% are colored in blue; proteins with a decrease below 50% detected by both methods are colored white.

References

    1. Mogk A., Huber D., Bukau B.(2011) Integrating protein homeostasis strategies in prokaryotes. Cold Spring Harb. Perspect. Biol. 3, a004366-a004366 - PMC - PubMed
    1. Frees D., Chastanet A., Qazi S., Sørensen K., Hill P., Msadek T., Ingmer H. (2004) Clp ATPases are required for stress tolerance, intracellular replication and biofilm formation in Staphylococcus aureus. Mol. Microbiol. 54, 1445–1462 - PubMed
    1. Elsholz A. K., Gerth U., Hecker M. (2010) Regulation of CtsR activity in low GC, Gram+ bacteria. Adv. Microb. Physiol. 57, 119–144 - PubMed
    1. Staub I., Sieber S. A. (2008) Beta-lactams as selective chemical probes for the in vivo labeling of bacterial enzymes involved in cell wall biosynthesis, antibiotic resistance, and virulence. J. Am. Chem. Soc. 130, 13400–13409 - PubMed
    1. Sass P., Josten M., Famulla K., Schiffer G., Sahl H.-G., Hamoen L., Brötz-Oesterhelt H. (2011) Antibiotic acyldepsipeptides activate ClpP peptidase to degrade the cell division protein FtsZ. Proc. Natl. Acad. Sci. U.S.A. 108, 17474–17479 - PMC - PubMed

Publication types

MeSH terms

LinkOut - more resources