. 2012 Jul;32(7):1687-95.
doi: 10.1161/ATVBAHA.112.250142. Epub 2012 May 3.

Stearic acid accumulation in macrophages induces toll-like receptor 4/2-independent inflammation leading to endoplasmic reticulum stress-mediated apoptosis

Affiliations

Stearic acid accumulation in macrophages induces toll-like receptor 4/2-independent inflammation leading to endoplasmic reticulum stress-mediated apoptosis

Emily K Anderson et al. Arterioscler Thromb Vasc Biol. 2012 Jul.

Abstract

Objective: Elevated serum free fatty acid levels are associated with an increased risk of cardiovascular disease and type 2 diabetes mellitus. Macrophages are recruited to atherosclerotic plaques and metabolic tissues during obesity and accumulate lipids, including free fatty acids. We investigated the molecular consequences of intracellular saturated free fatty acid accumulation in macrophages.

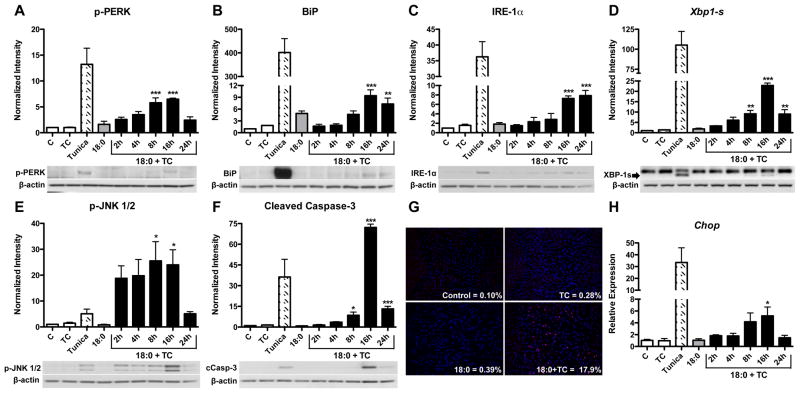
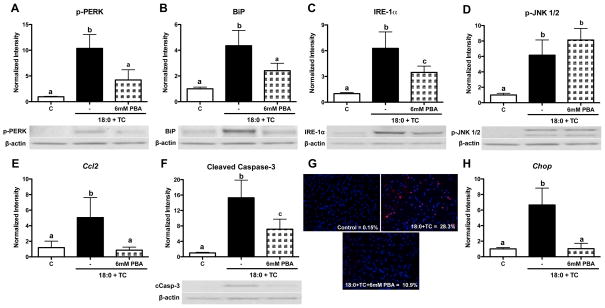
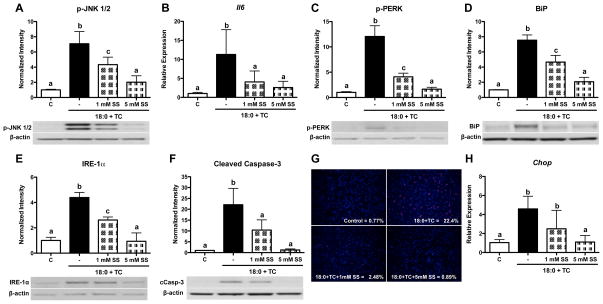
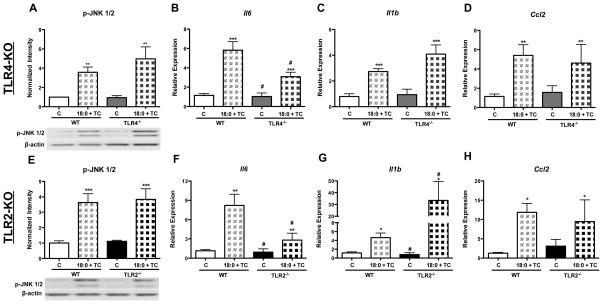
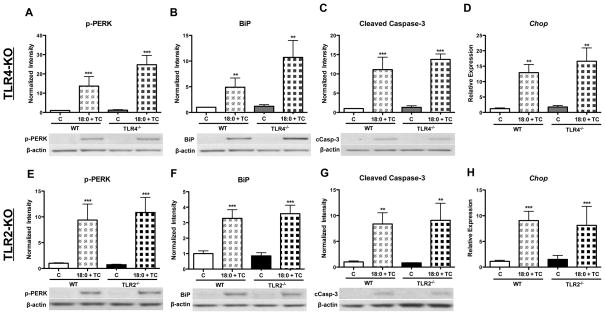
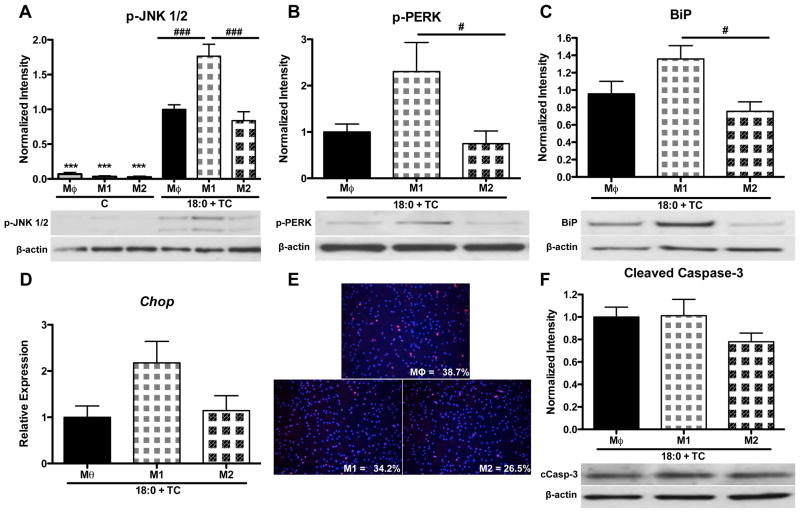
Methods and results: Previously, we demonstrated that cotreatment of mouse peritoneal macrophages (MPMs) with stearic acid and triacsin C (an inhibitor of long-chain acyl coenzyme A synthetases) results in intracellular free fatty acid accumulation and apoptosis. Here, we used Western blotting analysis, real-time reverse transcription polymerase chain reaction, and terminal deoxynucleotidyl transferase dUTP nick-end labeling staining to assess endoplasmic reticulum (ER) stress, inflammation, and apoptosis in MPMs. Intracellular stearic acid accumulation induces Toll-like receptor 4/2-independent inflammation that results in ER stress-mediated apoptosis of MPMs. Polarization of MPMs to a proinflammatory M1 phenotype increases their susceptibility to inflammation and ER stress, but not apoptosis, in response to cotreatment with stearic acid and triacsin C.

Conclusions: Intracellular accumulation of stearic acid in MPMs activates inflammatory signaling, leading to ER stress-mediated apoptosis. M1 macrophages are more prone to stearic acid-induced inflammation and ER stress. These same pathways may be activated in macrophages residing in atherosclerotic plaques and metabolic tissues during conditions of obesity and hyperlipidemia.


Conflict of interest statement

Disclosures: The authors have no conflict of interest.

Figures

Figure 1
Figure 1. Intracellular stearic acid accumulation induces ER stress, inflammation, and apoptosis
MPMs were co-treated with stearic acid (18:0, 90 μM) and TC (2.5 μM) for 2 to 24 h in DMEM containing 5% FBS. All controls [vehicle-treated (C), TC, tunicamycin (1 μM), and 18:0 alone] were treated for 24 h. A–C) Western blot analysis for markers of ER stress: A) phospho-PERK, B) BiP, C) IRE-1α. D) RT-PCR analysis of Xbp1 mRNA splicing. E–F) Western blot analysis of: E) phospho-JNK1/2 and F) cleaved caspase-3. G) Detection of apoptotic cells by TUNEL (red) and DAPI (blue) staining of MPMs treated for 16 h. Magnification: 20X. H) Gene expression analysis of Chop mRNA by real-time RT-PCR. Data are presented as mean ± SD, n = 3/group. Abbreviations: C, vehicle-treated control; TC, triacsin C; Tunica, tunicamycin; 18:0, stearic acid. * p<0.05, ** p<0.01, *** p<0.001 compared to control. Tunicamycin treatment was used as a positive control for Western blotting and is not included in statistical analysis.
Figure 2
Figure 2. PBA attenuates ER stress, chemokine secretion, and apoptosis, but not inflammation, induced by stearic acid accumulation
MPMs were co-treated with stearic acid (18:0, 90 μM) and TC (2.5 μM) in the presence or absence of PBA (6 mM) for 16 h in DMEM containing 5% FBS. A–D) Western blot analysis for: A) phospho-PERK, B) BiP, C) IRE-1α, D) phospho-JNK1/2. E) Real-time RT-PCR analysis of Ccl2 gene expression. F) Western blot analysis for cleaved caspase-3. G) TUNEL (red) and DAPI (blue) staining to detect apoptotic cells. Magnification: 20X. H) Gene expression analysis of Chop mRNA by real-time RT-PCR. Data are presented as mean ± SD, n = 4–5/group. Abbreviations: C, vehicle-treated control; TC, triacsin C; 18:0, stearic acid; PBA, 4-phenyl butyric acid. Groups not connected by the same letter are significantly different, p<0.05.
Figure 3
Figure 3. Inhibition of inflammation by sodium salicylate decreases MPM ER stress and apoptosis during stearic acid accumulation
MPMs were co-treated with stearic acid (18:0, 90 μM) and TC (2.5 μM) in the presence or absence of 1 or 5 mM SS for 16 h in DMEM containing 5% FBS. A) Western blot analysis of phospho-JNK1/2, B) Real-time RT-PCR analysis of Il6 gene expression. C–F) Western blot analysis for: C) phospho-PERK, D) BiP, E) IRE-1α, and F) cleaved caspase-3. G) TUNEL (red) and DAPI (blue) staining to detect apoptotic cells. Magnification: 20X. H) Gene expression analysis of Chop mRNA by real-time RT-PCR. Data are presented as mean ± SD, n = 3/group. Abbreviations: C, vehicle-treated control; TC, triacsin C; 18:0, stearic acid; SS, sodium salicylate. Groups not connected by the same letter are significantly different, p<0.05.
Figure 4
Figure 4. Absence of TLR4 or TLR2 does not protect MPMs from inflammation induced by stearic acid accumulation
MPMs were isolated from WT, TLR4-KO, and TLR2-KO mice and co-treated with stearic acid (18:0, 90 μM) and TC (2.5 μM) for 16 h in DMEM containing 5% FBS. A–D) Analysis of inflammatory markers in WT and TLR4-KO MPMs: A) Western blot of phospho-JNK 1/2, B–D) Real-time RT-PCR analysis of: B) Il6, C) Il1b, D) Ccl2. E–F) Analysis of inflammatory markers in WT and TLR2-KO MPMs: E) Western blot of phospho-JNK 1/2, F–H) Real-time RT-PCR analysis of: F) Il6, G) Il1b, H) Ccl2. Abbreviations: C, vehicle-treated control; TC, triacsin C; 18:0, stearic acid; WT, wild-type; TLR4−/−, toll-like receptor 4 knockout, TLR2−/−, toll-like receptor 2 knockout. * Treatment effect, p <0.05; ** Treatment effect, p<0.01; *** Treatment effect, p<0.001; # Genotype effect, p<0.05.
Figure 5
Figure 5. Absence of TLR4 or TLR2 does not protect MPMs from ER stress or apoptosis induced by stearic acid accumulation
MPMs were isolated from WT, TLR4-KO, and TLR2-KO mice and co-treated with stearic acid (18:0, 90 μM) and TC (2.5 μM) for 16 h in DMEM containing 5% FBS. A–D) Analysis of ER stress and apoptotic markers in WT and TLR4-KO MPMs: A–C) Western blot analysis of: A) phospho-PERK, B) BiP, C) Cleaved caspase-3. D) Real-time RT-PCR analysis of Chop gene expression. E–F) Analysis of ER stress and apoptotic markers in WT and TLR2-KO MPMs: EG) Western blot analysis of: E) phospho-PERK, F) BiP, G) Cleaved caspase-3. H) Real-time RT-PCR analysis of Chop gene expression. Abbreviations: C, vehicle-treated control; TC, triacsin C; 18:0, stearic acid; WT, wild-type; TLR4−/−, toll-like receptor 4 knockout, TLR2−/−, toll-like receptor 2 knockout. ** Treatment effect, p<0.01; *** Treatment effect, p<0.001.
Figure 6
Figure 6. Polarization of MPMs to an M1 phenotype increases susceptibility to inflammation and ER stress in response to intracellular stearic acid accumulation
MPMs were polarized for 24 h with vehicle, LPS (10 ng/ml), or IL-13 (4 ng/ml) to induce a Mθ, M1, or M2 phenotype, respectively. Cells were then co-treated with stearic acid (18:0, 90 μM) and TC (2.5 μM) for 16 h in the presence of polarization agents. Controls were treated for 40 h with polarizing agents in the absence of stearic acid and TC. A–C) Western blot analysis for: A) phospho-JNK 1/2, B) phospho-PERK, C) BiP. D) Gene expression analysis of Chop mRNA by real-time RT-PCR. E) Detection of apoptotic cells by TUNEL (red) and DAPI (blue) staining. Magnification: 20X. F) Western blot analysis of cleaved caspase-3. Data are presented as mean ± SD. n = 5–9/group. Abbreviations: C, control; TC, triacsin C; 18:0, stearic acid; Mθ, unpolarized macrophage; M1, LPS polarized macrophage; M2, IL-13 polarized macrophage. *** p<0.001 compared to Mθ of 18:0 + TC group, # p<0.05, ### p<0.001 compared to M1 of 18:0 + TC group.

References

    1. Mathew M, Tay E, Cusi K. Elevated plasma free fatty acids increase cardiovascular risk by inducing plasma biomarkers of endothelial activation, myeloperoxidase and pai-1 in healthy subjects. Cardiovasc Diabetol. 2010;9:1–9. - PMC - PubMed
    1. Pankow JS, Duncan BB, Schmidt MI, Ballantyne CM, Couper DJ, Hoogeveen RC, Golden SH. Fasting plasma free fatty acids and risk of type 2 diabetes: The atherosclerosis risk in communities study. Diabetes Care. 2004;27:77–82. - PubMed
    1. Ball RY, Stowers EC, Burton JH, Cary NR, Skepper JN, Mitchinson MJ. Evidence that the death of macrophage foam cells contributes to the lipid core of atheroma. Atherosclerosis. 1995;114:45–54. - PubMed
    1. Smith JD, Trogan E, Ginsberg M, Grigaux C, Tian J, Miyata M. Decreased atherosclerosis in mice deficient in both macrophage colony-stimulating factor (op) and apolipoprotein e. Proc Natl Acad Sci U S A. 1995;92:8264–8268. - PMC - PubMed
    1. Weisberg SP, McCann D, Desai M, Rosenbaum M, Leibel RL, Ferrante AW., Jr Obesity is associated with macrophage accumulation in adipose tissue. J Clin Invest. 2003;112:1796–1808. - PMC - PubMed

Publication types