

Proteomic analysis of wild-type and mutant huntingtin-associated proteins in mouse brains identifies unique interactions and involvement in protein synthesis
- PMID: 22556411
- PMCID: PMC3381125
- DOI: 10.1074/jbc.M112.359307
Proteomic analysis of wild-type and mutant huntingtin-associated proteins in mouse brains identifies unique interactions and involvement in protein synthesis
Abstract
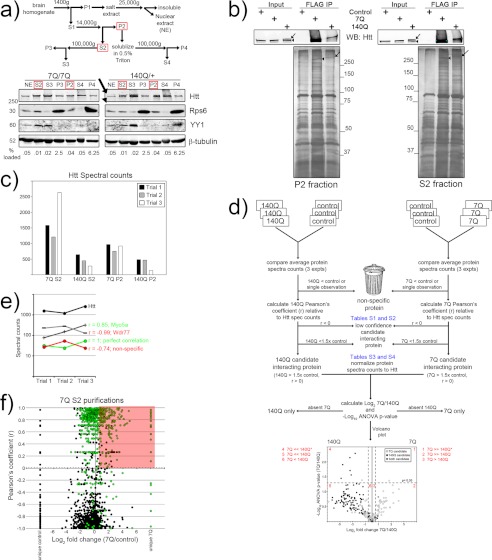
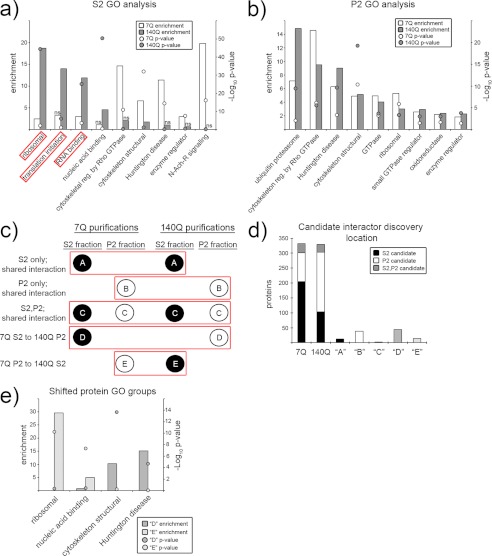
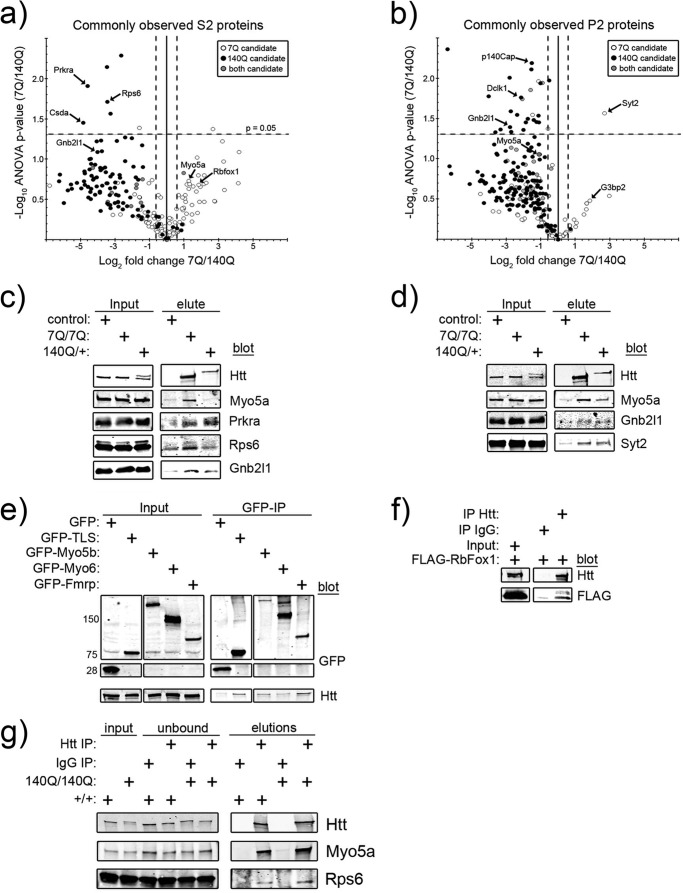
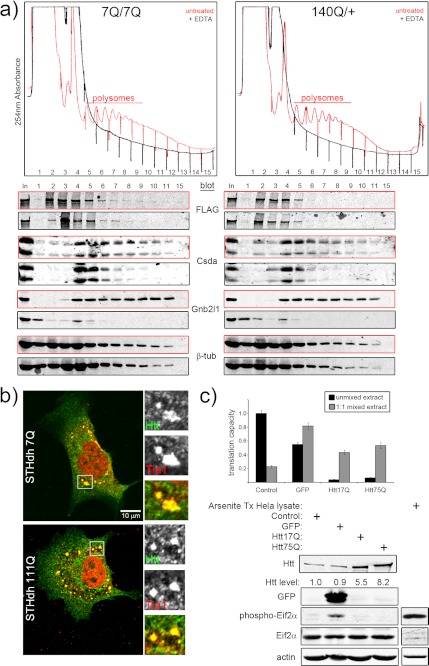
Huntington disease is a neurodegenerative disorder caused by a CAG repeat amplification in the gene huntingtin (HTT) that is reflected by a polyglutamine expansion in the Htt protein. Nearly 20 years of research have uncovered roles for Htt in a wide range of cellular processes, and many of these discoveries stemmed from the identification of Htt-interacting proteins. However, no study has employed an impartial and comprehensive strategy to identify proteins that differentially associate with full-length wild-type and mutant Htt in brain tissue, the most relevant sample source to the disease condition. We analyzed Htt affinity-purified complexes from wild-type and HTT mutant juvenile mouse brain from two different biochemical fractions by tandem mass spectrometry. We compared variations in protein spectral counts relative to Htt to identify those proteins that are the most significantly contrasted between wild-type and mutant Htt purifications. Previously unreported Htt interactions with Myo5a, Prkra (PACT), Gnb2l1 (RACK1), Rps6, and Syt2 were confirmed by Western blot analysis. Gene Ontology analysis of these and other Htt-associated proteins revealed a statistically significant enrichment for proteins involved in translation among other categories. Furthermore, Htt co-sedimentation with polysomes in cytoplasmic mouse brain extracts is dependent upon the presence of intact ribosomes. Finally, wild-type or mutant Htt overexpression inhibits cap-dependent translation of a reporter mRNA in an in vitro system. Cumulatively, these data support a new role for Htt in translation and provide impetus for further study into the link between protein synthesis and Huntington disease pathogenesis.
Figures
Similar articles
-
Mutant Huntingtin Protein Interaction Map Implicates Dysregulation of Multiple Cellular Pathways in Neurodegeneration of Huntington's Disease.J Huntingtons Dis. 2022;11(3):243-267. doi: 10.3233/JHD-220538. J Huntingtons Dis. 2022. PMID: 35871359 Free PMC article.
-
A series of N-terminal epitope tagged Hdh knock-in alleles expressing normal and mutant huntingtin: their application to understanding the effect of increasing the length of normal Huntingtin's polyglutamine stretch on CAG140 mouse model pathogenesis.Mol Brain. 2012 Aug 14;5:28. doi: 10.1186/1756-6606-5-28. Mol Brain. 2012. PMID: 22892315 Free PMC article.
-
Potent and selective antisense oligonucleotides targeting single-nucleotide polymorphisms in the Huntington disease gene / allele-specific silencing of mutant huntingtin.Mol Ther. 2011 Dec;19(12):2178-85. doi: 10.1038/mt.2011.201. Epub 2011 Oct 4. Mol Ther. 2011. PMID: 21971427 Free PMC article.
-
Selective degeneration in YAC mouse models of Huntington disease.Brain Res Bull. 2007 Apr 30;72(2-3):124-31. doi: 10.1016/j.brainresbull.2006.10.018. Epub 2006 Nov 16. Brain Res Bull. 2007. PMID: 17352936 Review.
-
Wild-type huntingtin plays a role in brain development and neuronal survival.Mol Neurobiol. 2003 Dec;28(3):259-76. doi: 10.1385/MN:28:3:259. Mol Neurobiol. 2003. PMID: 14709789 Review.
Cited by
-
Genetic manipulations of mutant huntingtin in mice: new insights into Huntington's disease pathogenesis.FEBS J. 2013 Sep;280(18):4382-94. doi: 10.1111/febs.12418. Epub 2013 Jul 31. FEBS J. 2013. PMID: 23829302 Free PMC article. Review.
-
Perturbed actin cap as a new personalized biomarker in primary fibroblasts of Huntington's disease patients.Front Cell Dev Biol. 2023 Jan 18;11:1013721. doi: 10.3389/fcell.2023.1013721. eCollection 2023. Front Cell Dev Biol. 2023. PMID: 36743412 Free PMC article.
-
Protein Co-Aggregation Related to Amyloids: Methods of Investigation, Diversity, and Classification.Int J Mol Sci. 2018 Aug 4;19(8):2292. doi: 10.3390/ijms19082292. Int J Mol Sci. 2018. PMID: 30081572 Free PMC article. Review.
-
Ribosomal Protein S6 Phosphorylation in the Nervous System: From Regulation to Function.Front Mol Neurosci. 2015 Dec 16;8:75. doi: 10.3389/fnmol.2015.00075. eCollection 2015. Front Mol Neurosci. 2015. PMID: 26733799 Free PMC article. Review.
-
Quantitative Proteomic Analysis Reveals Similarities between Huntington's Disease (HD) and Huntington's Disease-Like 2 (HDL2) Human Brains.J Proteome Res. 2016 Sep 2;15(9):3266-83. doi: 10.1021/acs.jproteome.6b00448. Epub 2016 Aug 3. J Proteome Res. 2016. PMID: 27486686 Free PMC article.
References
-
- Imarisio S., Carmichael J., Korolchuk V., Chen C. W., Saiki S., Rose C., Krishna G., Davies J. E., Ttofi E., Underwood B. R., Rubinsztein D. C. (2008) Huntington's disease. From pathology and genetics to potential therapies. Biochem. J. 412, 191–209 - PubMed
-
- Faber P. W., Barnes G. T., Srinidhi J., Chen J., Gusella J. F., MacDonald M. E. (1998) Huntingtin interacts with a family of WW domain proteins. Hum. Mol. Genet. 7, 1463–1474 - PubMed
Publication types
MeSH terms
Substances
Grants and funding
LinkOut - more resources
Full Text Sources
Other Literature Sources
Medical
Molecular Biology Databases
Miscellaneous
