. 2012 Jun 15;287(25):21110-20.
doi: 10.1074/jbc.M111.319129. Epub 2012 May 3.

Inhibition of autophagy rescues palmitic acid-induced necroptosis of endothelial cells

Affiliations

Inhibition of autophagy rescues palmitic acid-induced necroptosis of endothelial cells

Muhammad Jadoon Khan et al. J Biol Chem. .

Abstract

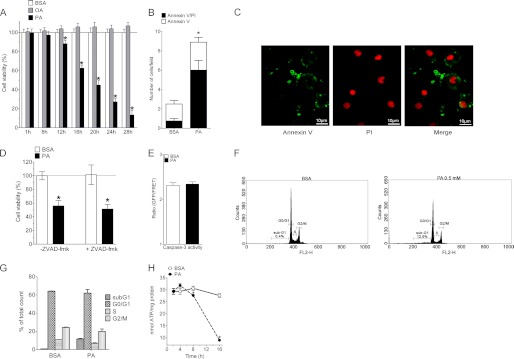
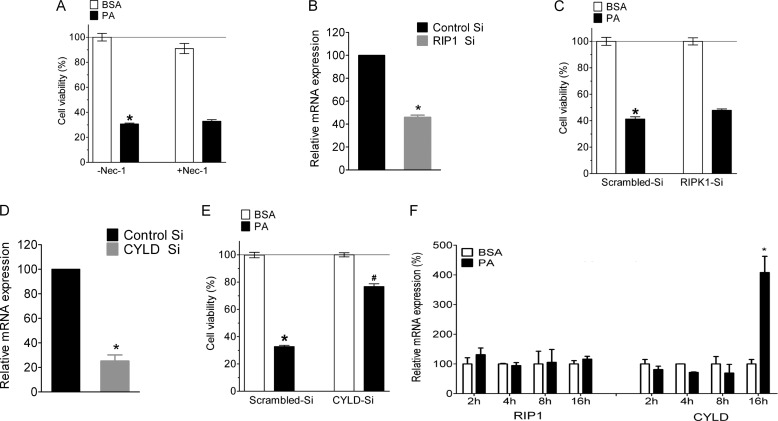
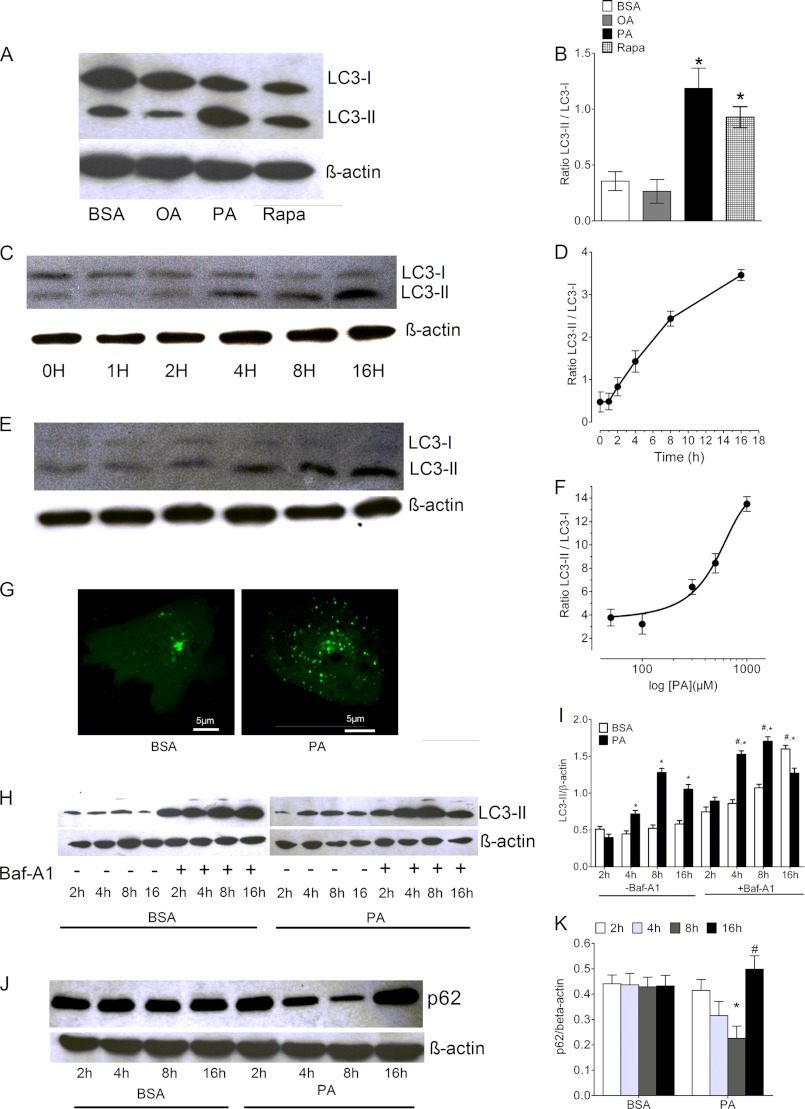
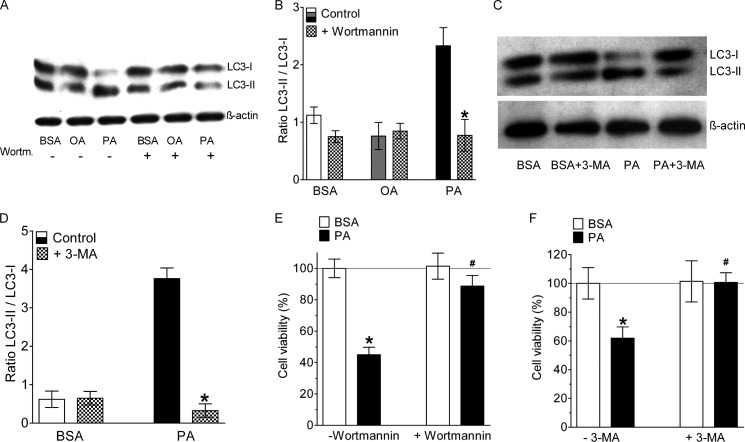
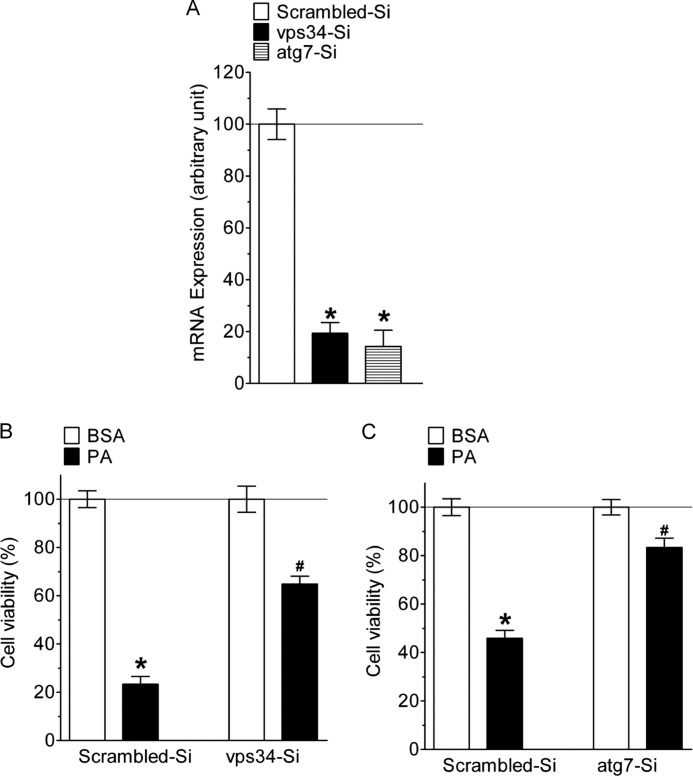
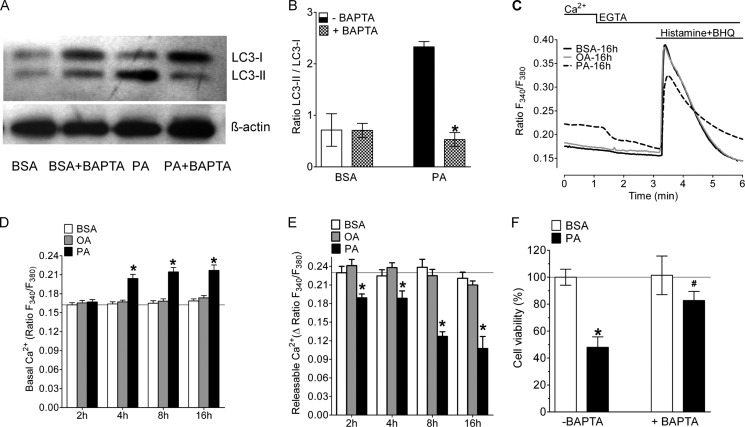
Accumulation of palmitic acid (PA) in cells from nonadipose tissues is known to induce lipotoxicity resulting in cellular dysfunction and death. The exact molecular pathways of PA-induced cell death are still mysterious. Here, we show that PA triggers autophagy, which did not counteract but in contrast promoted endothelial cell death. The PA-induced cell death was predominantly necrotic as indicated by annexin V and propidium iodide (PI) staining, absence of caspase activity, low levels of DNA hypoploidy, and an early ATP depletion. In addition PA induced a strong elevation of mRNA levels of ubiquitin carboxyl-terminal hydrolase (CYLD), a known mediator of necroptosis. Moreover, siRNA-mediated knockdown of CYLD significantly antagonized PA-induced necrosis of endothelial cells. In contrast, inhibition and knockdown of receptor interacting protein kinase 1 (RIPK1) had no effect on PA-induced necrosis, indicating the induction of a CYLD-dependent but RIPK1-independent cell death pathway. PA was recognized as a strong and early inducer of autophagy. The inhibition of autophagy by both pharmacological inhibitors and genetic knockdown of the autophagy-specific genes, vacuolar protein sorting 34 (VPS34), and autophagy-related protein 7 (ATG7), could rescue the PA-induced death of endothelial cells. Moreover, the initiation of autophagy and cell death by PA was reduced in endothelial cells loaded with the Ca(2+) chelator 1,2-bis(o-aminophenoxy)ethane-N,N,N',N'-tetraacetic acid-(acetoxymethyl) ester (BAPTA-AM), indicating that Ca(2+) triggers the fatal signaling of PA. In summary, we introduce an unexpected mechanism of lipotoxicity in endothelial cells and provide several novel strategies to counteract the lipotoxic signaling of PA.


Figures

FIGURE 1.
FIGURE 1.
PA induces necrotic cell death in endothelial cells. A, cells were treated with BSA alone (white columns, n = 3), 0.5 mm OA (gray columns, n = 3), or 0.5 mm PA (black columns, n = 3) and cell viability was measured with MTT assay at the time points indicated. Fatty acids were complexed to BSA. Data were normalized to BSA as control and represented as percentage viability. *, p < 0.05 versus BSA. B, annexin V/PI costaining for the cells exposed to 0.5 mm PA (n = 4) or BSA alone (n = 4) (asterisk refers to annexin V/PI). *, p < 0.05 versus BSA. C, representative images of annexin V/PI-stained endothelial cells treated with 0.5 mm PA for 12 h (n = 4). Images were taken using a ×40 objective. D, cells were treated with the solvent (DMSO, control, -Z-VAD-fmk, n = 3) or with 20 μm Z-VAD-fmk (+zVAD-fmk, n = 3) prior to treatment with 0.5 mm PA or BSA alone and cellular viability was measured with MTT assay. *, p < 0.05 versus BSA (51.3 ± 6.7% in the Z-VAD-fmk treated as compared with 55.9 ± 7.7% in controls). E, caspase-3 activity measured with the FRET-based sensor Casper 3-GR, expressed as ratio GFP/FRET of randomly selected cells under control conditions (BSA, white column, n = 3, 81 cells) and after cell treatment with 0.5 mm PA for 16–18 h (n = 3, 102 cells). F, histograms of cell cycle analysis by flow cytometry for DNA hypoploidy. Cells were treated with BSA or 0.5 mm PA and were analyzed after 18 h of incubation. G, statistical analysis of the histograms shown in panel F. H, statistical data representing nmol of ATP/mg of protein in the cells exposed to 0.5 mm PA (black circles, dotted line, n = 6 for each time point) or BSA alone (white circles, continuous line, n = 6 for each time point). *, p < 0.05 versus BSA.
FIGURE 2.
FIGURE 2.
PA induces RIPK1 independent but CYLD dependent necroptosis in endothelial cells. A, cells were pretreated with solvent (DMSO, control, -Nec-1, n = 4) or 30 μm necrostatin-1 (+Nec-1, n = 4) for 20 min and were incubated for 24 h with BSA or 0.5 mm PA and cellular viability was measured with MTT assay. *, p < 0.05 versus BSA. B, knockdown efficiency of RIPK1 (RIP1) siRNA in the percentage of mRNA expression compared with scramble siRNA (n = 3 for all columns presented). *, p < 0.05 versus scrambled siRNA. C, cell viability 48 h after transfection of cells with either scrambled siRNA (left pair of columns, n = 18 for both conditions) or siRNA against RIPK1 (right pair of columns, n = 18 for both conditions). Cells were incubated for 24 h with BSA alone (white columns) or 0.5 mm PA complexed to BSA (black columns) and cell viability was measured using the MTT assay. Viability is expressed in percentage, whereas the average value of cells treated with scrambled siRNA and BSA alone was defined as 100%. *, p < 0.05 versus BSA, and #, p < 0.05 versus PA with scrambled siRNA (47.8 ± 1.0% dead cells in RIPK1-siRNA as compared with 41.2 ± 1.6% dead cells in scrambled siRNA). D, knockdown efficiency of CYLD siRNA in percentage of mRNA expression compared with scramble siRNA (n = 6). *, p < 0.05 versus scrambled siRNA. At 16 h more than 40% of the cells were found dead by the MTT assay as shown in Fig. 1A. E, impact of siRNA-mediated knockdown of CYLD on cell viability under analogous conditions described in panel C (n = 18 for each column). *, p < 0.05 versus BSA, and #, p < 0.05 versus PA with scrambled siRNA. F, the relative mRNA expression of RIPK1 and CYLD in cells treated with BSA or 0.5 mm PA for 2, 4, 8, and 16 h. The relative expression is presented as a percentage of BSA-treated cells at the given time point. *, p < 0.05 versus BSA at the given time point (n = 3).
FIGURE 3.
FIGURE 3.
PA induces autophagy in endothelial cells. A, cells were treated with BSA, OA, PA, and rapamycine (Rapa) for 8 h and the extracted protein was immunoblotted against LC3 antibody. β-Actin was used to normalize the data for equal protein loading. B, columns represent the average band densities from 3 different experiments as shown in panel A. *, p < 0.05 versus BSA. C and D, time dependence of the PA-induced cleavage of LC3 expressed as the LC3-II/LC3-I ratio over time (n = 3 for each time point). E and F, concentration-response curve of PA-induced cleavage of LC3 (n = 3 for each concentration). PA was complexed to BSA. G, representative images of cells expressing Venus-LC3. Images show the subcellular distribution of Venus-LC3 in control cells (left image, BSA alone for 8 h after cell transfection) and in cells treated for 8 h with 0.5 mm PA complexed to BSA (right image). H, cell were treated with BSA or 0.5 mm PA in the presence or absence of bafilomycin A1 (Baf-A1) and the isolated proteins at the given time points were immunoblotted for LC3. Representative image of three independent experiments is presented, whereas statistical data of three independent experiments are shown in panel I. *, p < 0.05 versus BSA at a given time point, and #, p < 0.05 versus PA with treated with DMSO (control, -Baf-A1) at a given time point (n = 3). J, a representative image of three independent experiments showing the degradation pattern of p62. Cells were treated with BSA or 0.5 mm PA and isolated proteins at the given time points were blotted for p62. Statistical data of three independent experiments are shown in panel K). *, p < 0.05 versus BSA at a given time point; #, p < 0.05 versus PA at 8-h time point (n = 3).
FIGURE 4.
FIGURE 4.
Inhibition of autophagy rescued endothelial cells from PA-induced death. A, representative Western blot showing LC3 cleavage of cells that were incubated for 8 h with BSA alone, 0.5 mm OA, or 0.5 mm PA in the absence (−) and presence (+) of 10 μm wortmannin. B, statistical data of LC3 cleavage from Western blots shown in panel f (n = 3 for all conditions). *, p < 0.05 versus control. C, representative Western blot showing LC3 cleavage of cells that were incubated for 8 h with BSA alone or 0.5 mm PA in the absence (−) and presence (+) of 10 mm 3-MA. D, statistical data of LC3 cleavage from Western blots shown in panel f (n = 3 for all conditions). *, p < 0.05 versus control. E, columns represent average cell viabilities that were determined using the MTT assay of cells not pretreated with wortmannin (left pair of columns, −Wortmannin) that were incubated for 24 h with BSA alone (left white column, n = 3) or with 0.5 mm PA complexed to BSA (left black column, n = 3), and cells pretreated with 10 μm wortmannin (right pair of columns, +Wortmannin) for 20 min prior to an incubation with either BSA alone (right white column, n = 3) or with 0.5 mm PA complexed to BSA (right black column, n = 3). *, p < 0.05 versus BSA, and #, p < 0.05 versus PA without wortmannin. F, cells were treated with 10 mm 3-MA, another specific inhibitor of PI3K III and autophagy, and cell death was analyzed by the MTT assay (n = 3 for all conditions). *, p < 0.05 versus BSA, and #, p < 0.05 versus PA without 3-MA.
FIGURE 5.
FIGURE 5.
Genetic knockdown of autophagy specific genes rescued cells from PA-induced cell death. A, knockdown efficiency of individual siRNA in the percentage of mRNA expression compared with scramble siRNA (n = 3 for all columns presented). *, p < 0.05 versus scrambled siRNA. B, 48 h after cells transfection with either scrambled siRNA (left pair of columns, n = 9 for both conditions) or siRNA against VPS34 (right pair of columns, n = 9 for both conditions) cells were incubated for 24 h with BSA alone (white columns) or 0.5 mm PA complexed to BSA (black columns) and cell viability was measured using the MTT assay. Viability is expressed in percentage, whereas the average value of cells treated with scrambled siRNA and BSA alone was defined as 100%. *, p < 0.05 versus BSA, and #, p < 0.05 versus PA with scrambled siRNA. C, impact of siRNA-mediated knockdown of ATG7 on cell viability under analogous conditions described in panel b (n = 9 for each column). *, p < 0.05 versus BSA, and #, p < 0.05 versus PA with scrambled siRNA.
FIGURE 6.
FIGURE 6.
PA-induced autophagy and cell death is a Ca2+-dependent process. A, representative Western blot showing LC3 cleavage of BAPTA-AM-loaded cells that were incubated for 8 h with BSA alone or 0.5 mm PA. B, statistical data of LC3 cleavage from Western blots (n = 3 for all conditions). *, p < 0.05 versus control. PA induces release of Ca2+ from ER and results in cytosolic Ca2+ elevation. C, representative Ca2+ signals of Fura-2/AM-loaded cells 16 h after incubation with BSA alone (black continuous line), 0.5 mm OA (gray continuous line), and 0.5 mm PA (black dotted line). The indicated signals were first recorded in Ca2+ containing medium (2 mm) and subsequently Ca2+ was mobilized from the ER by cell stimulation with 100 μm histamine and 15 μm BHQ in a Ca2+-free medium (1 mm EGTA). D, statistics of basal ratio values of Fura-2/AM-loaded cells in the presence of extracellular Ca2+ (2 mm), and E, average δ values of the maximal Ca2+ peaks upon cell stimulation with 100 μm histamine and 15 μm BHQ in the absence of extracellular Ca2+ (1 mm EGTA) at different times after incubation with BSA alone (Control, white columns, n = 9, ×118 cells at 2 h, ×127 cells at 4 h, ×130 cells at 8 h, and ×127 cells at 16 h), with 0.5 mm OA (gray columns, n = 9, ×113 cells at 2 h, ×127 cells at 4 h, ×133 cells at 8 h, and ×132 cells at 16 h), and with 0.5 mm PA (black columns, n = 9, ×115 cells at 2 h, ×124 cells at 4 h, ×118 cells at 8 h and ×107 cells at 16 h). *, p < 0.05 versus BSA. F, effect of chelating cytosolic Ca2+ on cell viability. Cells were pretreated with BAPTA-AM for 20 min and then incubated with 0.5 mm PA or BSA alone for 24 h. Cell viability was measured with the MTT assay and data were normalized to BSA as a control and represented as mean viability (n = 3, for all conditions). *, p < 0.05 versus BSA, and #, p < 0.05 versus PA without BAPTA-AM-loaded cells.

References

    1. Brookheart R. T., Michel C. I., Schaffer J. E. (2009) As a matter of fat. Cell Metab. 10, 9–12 - PMC - PubMed
    1. Unger R., Zhou Y. (2001) Lipotoxicity of beta cells in obesity and in other causes of fatty acid spillover. Diabetes 1, S118–S121 - PubMed
    1. Borradaile N. M., Schaffer J. E. (2005) Lipotoxicity in the heart. Curr. Hypertens. Rep. 7, 412–417 - PubMed
    1. Pfaffenbach K. T., Gentile C. L., Nivala A. M., Wang D., Wei Y., Pagliassotti M. J. (2010) Linking endoplasmic reticulum stress to cell death in hepatocytes. Roles of C/EBP homologous protein and chemical chaperones in palmitate-mediated cell death. Am. J. Physiol. Endocrinol. Metab. 298, E1027–E1035 - PMC - PubMed
    1. Mayer C. M., Belsham D. D. (2010) Palmitate attenuates insulin signaling and induces endoplasmic reticulum stress and apoptosis in hypothalamic neurons. Rescue of resistance and apoptosis through adenosine 5′-monophosphate-activated protein kinase activation. Endocrinology. 151, 576–585 - PubMed

Publication types

MeSH terms

Substances