. 2012 Jun 22;287(26):22099-111.
doi: 10.1074/jbc.M112.369157. Epub 2012 May 3.

High potency zinc modulation of human P2X2 receptors and low potency zinc modulation of rat P2X2 receptors share a common molecular mechanism

Affiliations

High potency zinc modulation of human P2X2 receptors and low potency zinc modulation of rat P2X2 receptors share a common molecular mechanism

Sukanya Punthambaker et al. J Biol Chem. .

Abstract

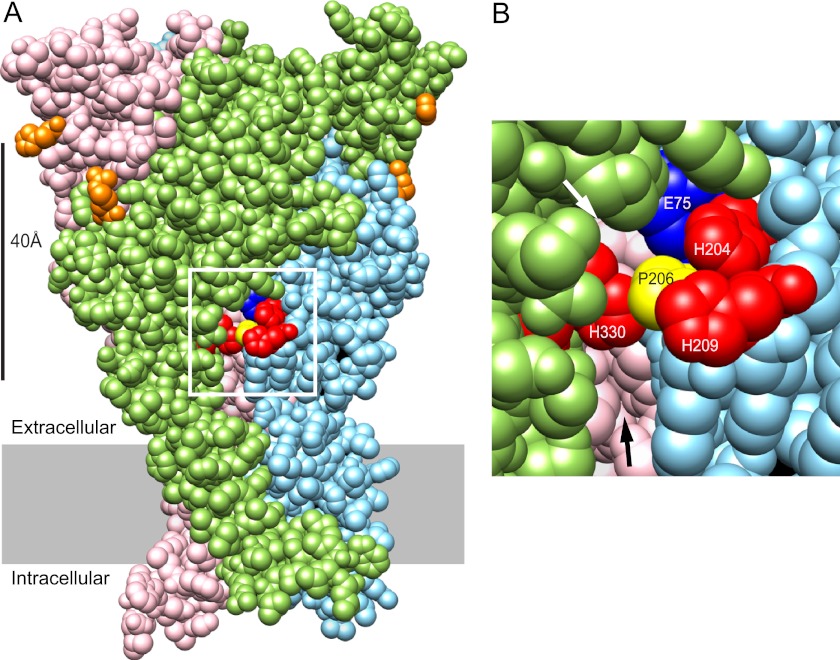
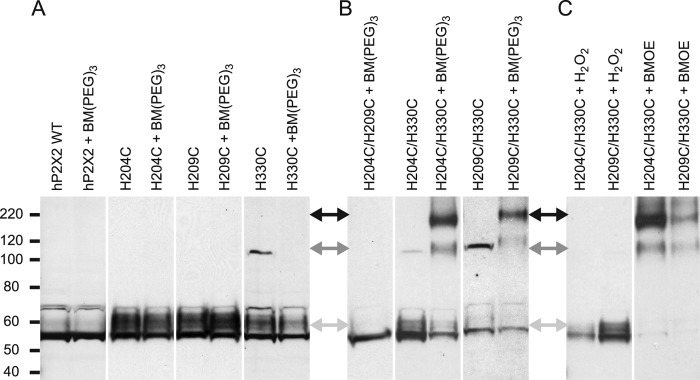
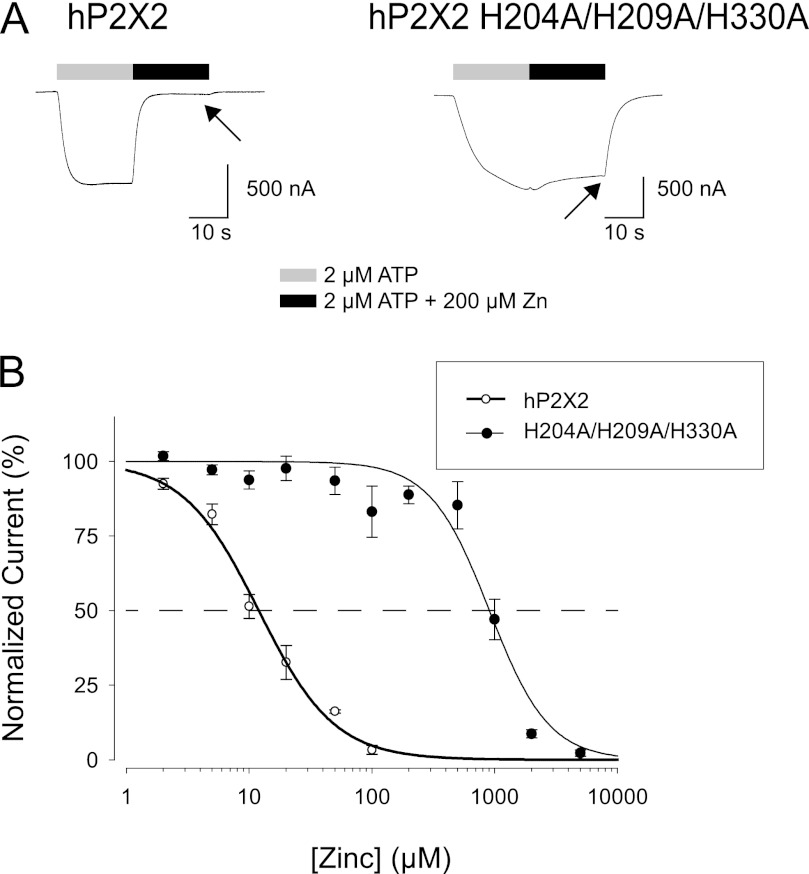
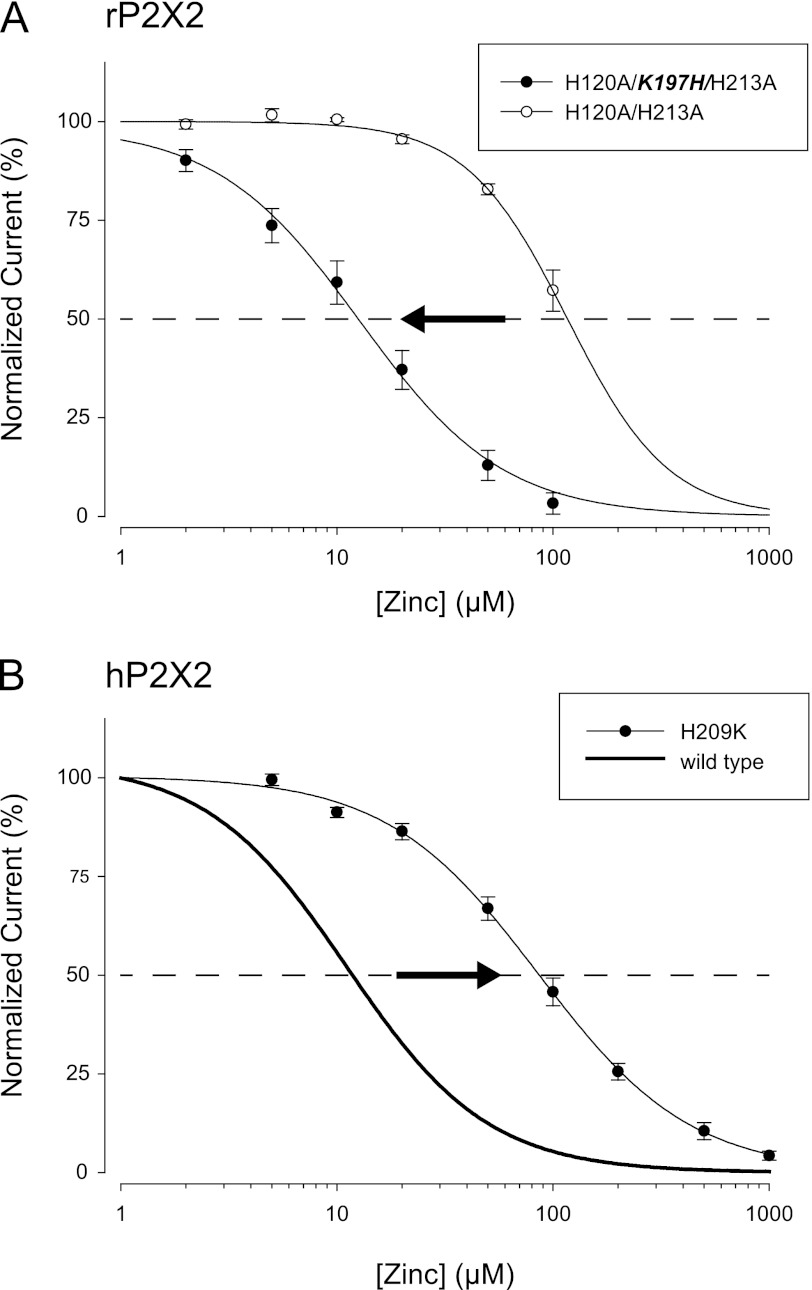
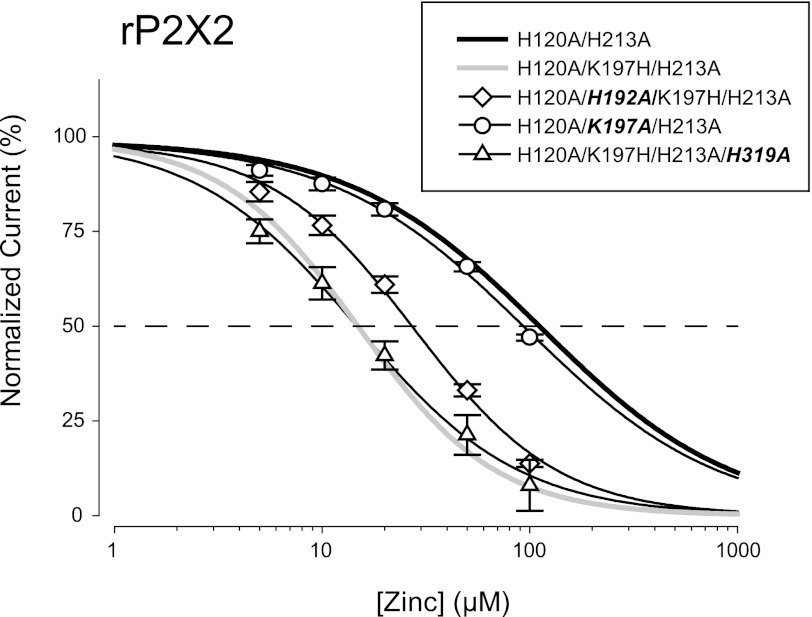
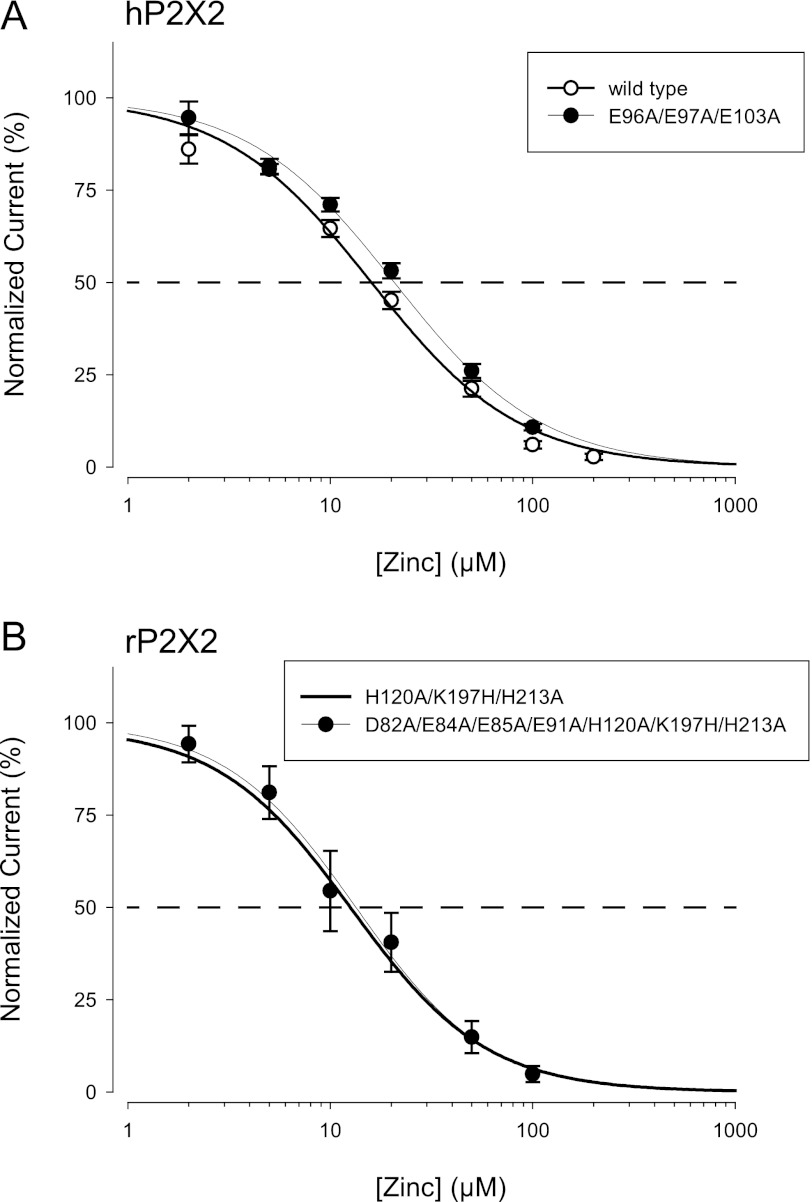
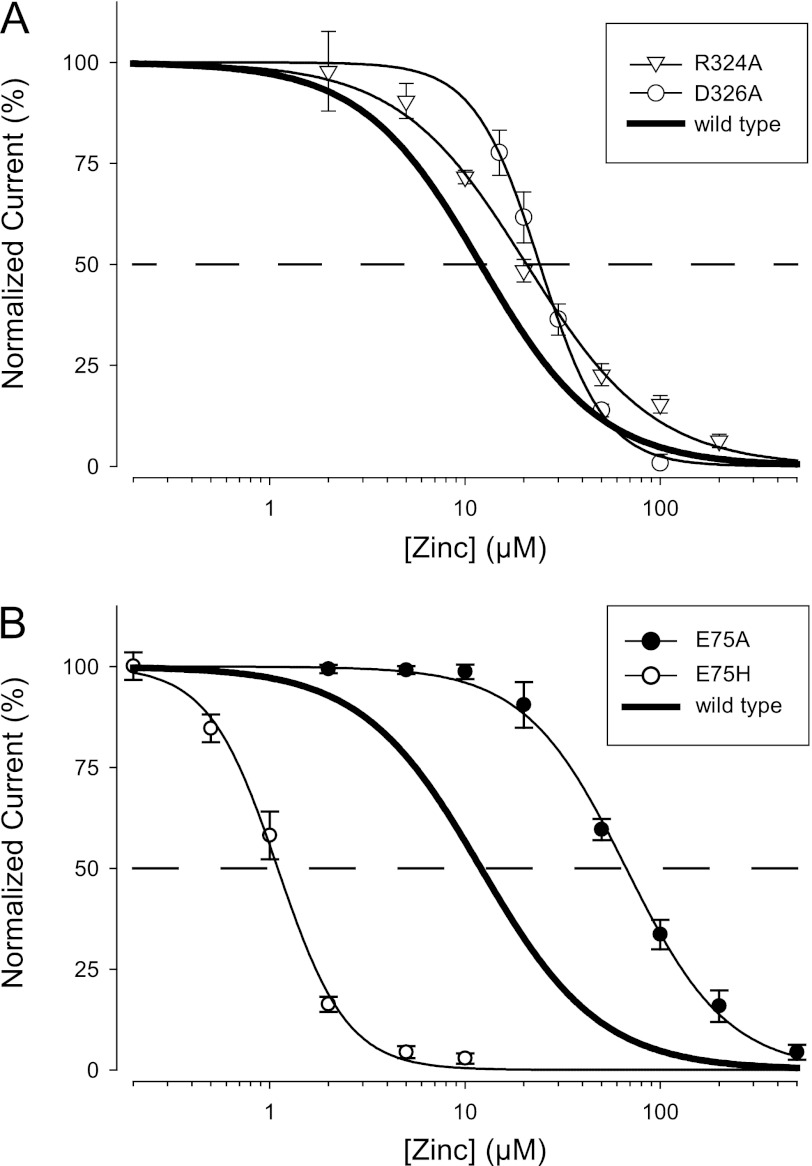
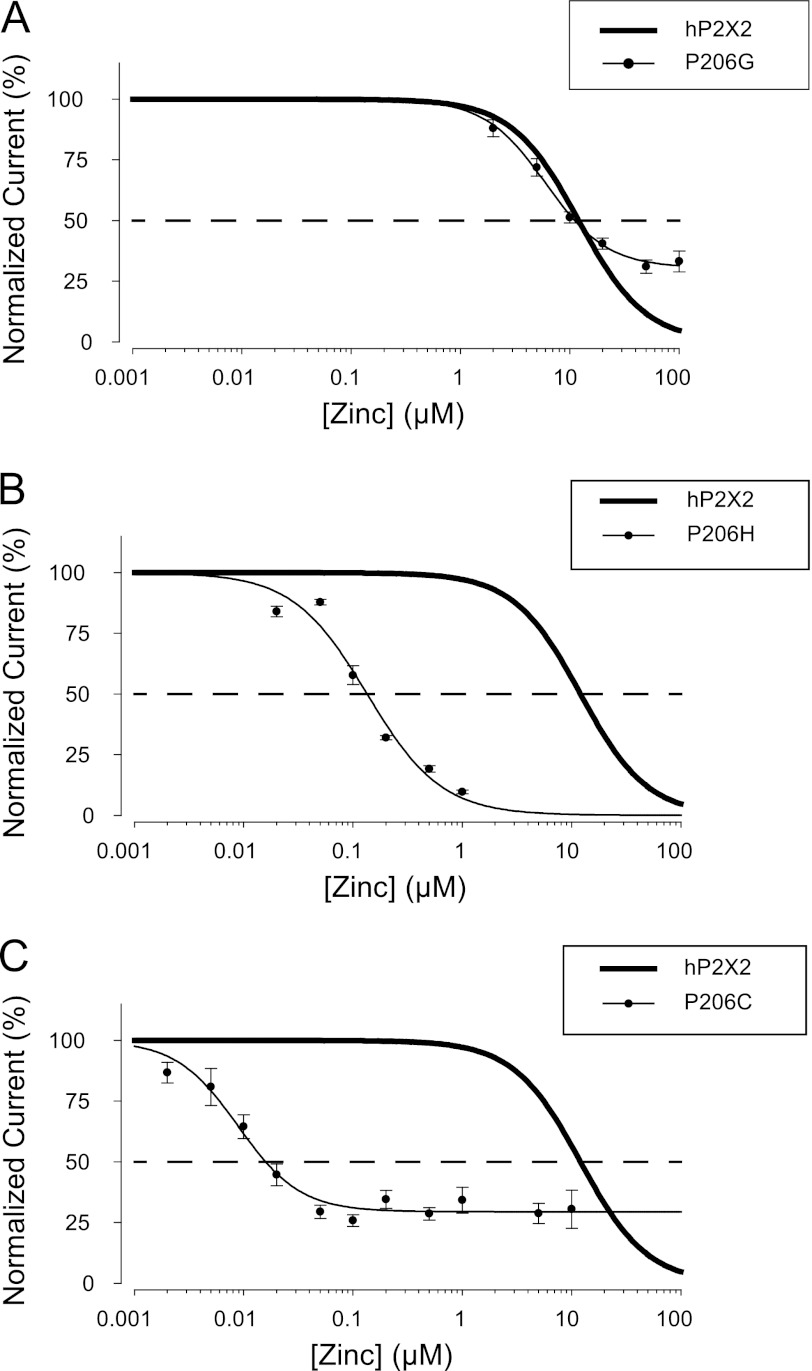
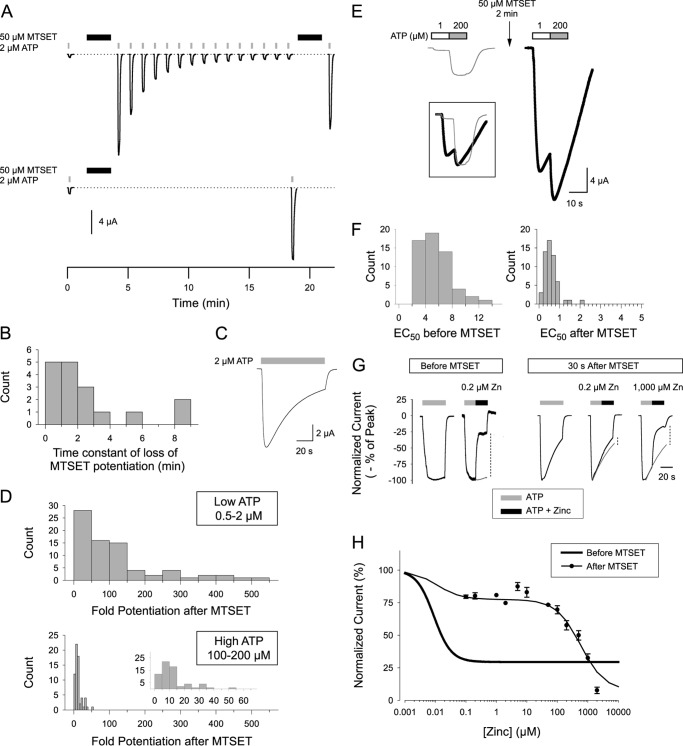
Human P2X2 receptors (hP2X2) are strongly inhibited by zinc over the range of 2-100 μM, whereas rat P2X2 receptors (rP2X2) are strongly potentiated over the same range, and then inhibited by zinc over 100 μM. However, the biological role of zinc modulation is unknown in either species. To identify candidate regions controlling zinc inhibition in hP2X2 a homology model based on the crystal structure of zebrafish P2X4.1 was made. In this model, His-204 and His-209 of one subunit were near His-330 of the adjacent subunit. Cross-linking studies confirmed that these residues are within 8 Å of each other. Simultaneous mutation of these three histidines to alanines decreased the zinc potency of hP2X2 nearly 100-fold. In rP2X2, one of these histidines is replaced by a lysine, and in a background in which zinc potentiation was eliminated, mutation of Lys-197 to histidine converted rP2X2 from low potency to high potency inhibition. We explored whether the zinc-binding site lies within the vestibules running down the central axis of the receptor. Elimination of all negatively charged residues from the upper vestibule had no effect on zinc inhibition. In contrast, mutation of several residues in the hP2X2 middle vestibule resulted in dramatic changes in the potency of zinc inhibition. In particular, the zinc potency of P206C could be reversibly shifted from extremely high (∼10 nM) to very low (>100 μM) by binding and unbinding MTSET. These results suggest that the cluster of histidines at the subunit interface controls access of zinc to its binding site.


Figures

FIGURE 1.
FIGURE 1.
Location of candidate residues for participation in the inhibitory zinc binding of hP2X2. A, homology model of hP2X2 based on the structure of zP2X4.1 in the closed state. The three identical subunits of this trimeric protein are shown in pink, green, and light blue. The positions shown in orange (His-132 and Arg-225) are equivalent to the two histidines of rP2X2 that are required for the potentiating effect of zinc. The positions of the three histidines to be tested for participation in the inhibitory zinc-binding site are shown in red. The white box shows the region illustrated in B. B, higher resolution view of the region around the three candidate histidines. His-204 and His-209 are close to each other on the light blue subunit, whereas the nearest His-330 is on the adjacent green subunit. In this closed state model, Pro-206 (yellow) of the light blue subunit partially shields His-330 from access to His-204 and His-209. The black arrow indicates the top of the fenestration that provides access to the extracellular vestibule. Several residues on the inside of this vestibule arising from the pink subunit are visible. The white arrow indicates a smaller fenestration into the middle vestibule. The visible residue arising from the pink subunit at the back of the middle vestibule is Ser-76. Another middle vestibule residue visible through this opening is Glu-75 (dark blue) from the same subunit as His-204 and His-206.
FIGURE 2.
FIGURE 2.
Biochemical test of accessibility of H204C or H209C to H330C of the adjacent subunit. A, lack of effect of the cysteine reactive cross-linker BM(PEG)3 on the indicated single cysteine mutant constructs. The positions of the molecular mass markers (in kDa) shown on the left apply to panels A–C. The double headed arrows between panels A and B and panels B and C indicate the expected position of monomers (light gray arrows), dimers (dark gray arrows), and trimers (black arrows). B, effect of BM(PEG)3 on double cysteine mutants. C, effect of the oxidizing agent H2O2 and the cysteine reactive cross-linker BMOE on double cysteine mutants.
FIGURE 3.
FIGURE 3.
Effect of elimination of the three clustered histidines. A, two electrode voltage clamp recordings from Xenopus oocytes expressing hP2X2 or the hP2X2 H204A/H209A/H330A mutant. In all experiments, the holding potential was −50 mV. The arrow indicates the current at the end of the period of zinc application. B, concentration-response relationship for a series of oocytes studied as in A. In these experiments, a range of concentrations of zinc were tested, whereas the ATP concentration was held constant at 2 μm. The data were fit to the 3 parameter Hill equation (wild-type, IC50 = 11 μm; H204A/H209A/H330A, IC50 = 979 μm).
FIGURE 4.
FIGURE 4.
Reciprocal effects of mutations of rP2X2 and hP2X2 on zinc inhibition. In both panels the arrow indicates the direction of the change in zinc potency when the endogenous residue was changed to the residue found in the same position in the other species. A, zinc concentration-response relationship for two variants of rP2X2 that lacks critical residues at the potentiating zinc-binding site (H120A/H213A). The residue at position 197 was either the normal lysine, or was mutated to a histidine, as is found at the equivalent site in hP2X2. B, zinc concentration-response relationship for wild-type hP2X2 (same data as Fig. 3, so only the fit is shown) and for a mutant in which His-209 was changed to lysine, as found at the equivalent site (position 197) of rat P2X2.
FIGURE 5.
FIGURE 5.
Potency of zinc inhibition in a series of rP2X2 mutants. All mutants were made deficient in zinc potentiation by the presence of the H120A and H213A mutations. Effect of substituting an alanine at His-192, Lys-197, or His-319 (equivalent residues to hP2X2 His-204, His-209, or His-330). The bold part of each label indicates the change from humanized rP2X2. The thick lines without points are reprints of the fits to data from H120A/H213A and H120A/K197H/H213A that were presented in Fig. 4.
FIGURE 6.
FIGURE 6.
Effect of removal of negative charges from the upper vestibule on zinc inhibition. A, comparison of the zinc concentration-response relationship for wild-type hP2X2 and a variant in which three negative charges in the upper vestibule were mutated to alanine. B, comparison of the zinc concentration-response relationship for humanized rP2X2 (H120A/K197H/H213A) and humanized rP2X2 in which all four negative charges in the upper vestibule were mutated to alanine. The average IC50 for the mutant lacking negative charges in the upper vestibule was 11 ± 3 μm, n = 5.
FIGURE 7.
FIGURE 7.
Effect of removal of negative charges from the middle vestibule on zinc inhibition. All mutants were made in hP2X2. Data from five cells were averaged for each mutant. A, zinc concentration-response relationship for R324A (IC50 = 20.1 ± 1.7 μm) and D326A (IC50 = 17.9 ± 0.9 μm). B, zinc concentration-response relationship for Glu-75 mutants (IC50 values were E75A = 68.2 ± 7.0 μm; E75H = 1.6 ± 0.1 μm).
FIGURE 8.
FIGURE 8.
Effect of mutations at hP2X2 Pro-206 on zinc potency. A, zinc inhibition of P206G. Because the final value at high zinc was not 0, the four-parameter version of the Hill equation was used to fit these data. The thick line without points in panels A–C is the response of wild-type hP2X2 initially shown in Fig. 4. B, zinc inhibition of P206H (IC50 = 0.09 ± 0.02 μm, n = 13). C, zinc inhibition of P206C.
FIGURE 9.
FIGURE 9.
Effect of MTSET on responses of hP2X2 P206C to ATP and zinc. A, massive, but transient potentiation of ATP responses by MTSET. Top, after an initial 10-s application of ATP (gray box) MTSET was applied for 2 min (black box), and after a 30-s washout, 10-s ATP pulses were given once per minute. After 15 ATP pulses, MTSET was reapplied, and then a final ATP pulse was given. Bottom, the first ATP pulse after MTSET was delayed until 15 min after the washout of MTSET. B, histogram of the time constant of loss of potentiation after MTSET for a series of cells tested as in the top panel of A. C, more rapid loss of potentiation when a long ATP pulse was used. D, histogram of the fold-potentiation after MTSET when tested with ATP concentrations near the EC10 prior to MTSET treatment (top) or with ATP concentrations that caused a nearly maximal response prior to MTSET treatment (bottom). E, traces illustrating the shift in the ATP concentration-response relationship after MTSET treatment. At both concentrations 200 μm produced a maximal response. MTSET treatment shifted the response to 1 μm from 9% of maximal to 81% of maximal. The traces inset within the box show the responses to 200 μm normalized to the same peak amplitude, to accentuate the relative change in the response to 1 μm ATP. F, histogram of the EC50 for ATP before and immediately after MTSET from experiments done as in panel E. G, recordings illustrating the change in zinc inhibition immediately after MTSET treatment. For each panel 4–5 traces obtained under the indicated conditions were normalized to the peak current and then averaged. The gray traces in the panels with zinc represent the extrapolated response amplitudes with ATP only. The top and bottom of the vertical dashed lines indicate the amplitude of the responses with and without zinc that were used to calculate the extent of zinc inhibition. In all panels, ATP was 1 μm. The time calibration applies to all panels. H, zinc concentration-response relationship measured after MTSET calculated from data collected and measured as in G, The thick black line is the fit from Fig. 8C. The thin black line is the fit to the model described in text. The concentration of ATP used in this experiment was the EC10 for ATP prior to MTSET, so it was near the EC80 after MTSET.

Similar articles

Cited by

References

    1. North R. A. (2002) Molecular physiology of P2X receptors. Physiol. Rev. 82, 1013–1067 - PubMed
    1. Kawate T., Michel J. C., Birdsong W. T., Gouaux E. (2009) Crystal structure of the ATP-gated P2X4 ion channel in the closed state. Nature 460, 592–598 - PMC - PubMed
    1. Coddou C., Stojilkovic S. S., Huidobro-Toro J. P. (2011) Allosteric modulation of ATP-gated P2X receptor channels. Rev. Neurosci. 22, 335–354 - PMC - PubMed
    1. Nakazawa K., Ohno Y. (1996) Dopamine and 5-hydroxytryptamine selectively potentiate neuronal type ATP receptor channels. Eur. J. Pharmacol. 296, 119–122 - PubMed
    1. Wildman S. S., King B. F., Burnstock G. (1998) Zn2+ modulation of ATP-responses at recombinant P2X2 receptors and its dependence on extracellular pH. Br. J. Pharmacol. 123, 1214–1220 - PMC - PubMed

Publication types

MeSH terms

LinkOut - more resources