Matrix disruptions, growth, and degradation of cartilage with impaired sulfation
- PMID: 22556422
- PMCID: PMC3381162
- DOI: 10.1074/jbc.M110.116467
Matrix disruptions, growth, and degradation of cartilage with impaired sulfation
Abstract
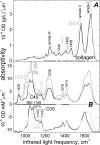
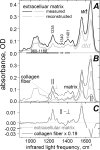
Diastrophic dysplasia (DTD) is an incurable recessive chondrodysplasia caused by mutations in the SLC26A2 transporter responsible for sulfate uptake by chondrocytes. The mutations cause undersulfation of glycosaminoglycans in cartilage. Studies of dtd mice with a knock-in Slc26a2 mutation showed an unusual progression of the disorder: net undersulfation is mild and normalizing with age, but the articular cartilage degrades with age and bones develop abnormally. To understand underlying mechanisms, we studied newborn dtd mice. We developed, verified and used high-definition infrared hyperspectral imaging of cartilage sections at physiological conditions, to quantify collagen and its orientation, noncollagenous proteins, and chondroitin chains, and their sulfation with 6-μm spatial resolution and without labeling. We found that chondroitin sulfation across the proximal femur cartilage varied dramatically in dtd, but not in the wild type. Corresponding undersulfation of dtd was mild in most regions, but strong in narrow articular and growth plate regions crucial for bone development. This undersulfation correlated with the chondroitin synthesis rate measured via radioactive sulfate incorporation, explaining the sulfation normalization with age. Collagen orientation was reduced, and the reduction correlated with chondroitin undersulfation. Such disorientation involved the layer of collagen covering the articular surface and protecting cartilage from degradation. Malformation of this layer may contribute to the degradation progression with age and to collagen and proteoglycan depletion from the articular region, which we observed in mice already at birth. The results provide clues to in vivo sulfation, DTD treatment, and cartilage growth.
Figures


Similar articles
-
Defective proteoglycan sulfation of the growth plate zones causes reduced chondrocyte proliferation via an altered Indian hedgehog signalling.Matrix Biol. 2010 Jul;29(6):453-60. doi: 10.1016/j.matbio.2010.05.001. Epub 2010 May 11. Matrix Biol. 2010. PMID: 20470884
-
Proteoglycan sulfation in cartilage and cell cultures from patients with sulfate transporter chondrodysplasias: relationship to clinical severity and indications on the role of intracellular sulfate production.Matrix Biol. 1998 Oct;17(5):361-9. doi: 10.1016/s0945-053x(98)90088-9. Matrix Biol. 1998. PMID: 9822202
-
Undersulfation of cartilage proteoglycans ex vivo and increased contribution of amino acid sulfur to sulfation in vitro in McAlister dysplasia/atelosteogenesis type 2.Eur J Biochem. 1997 Sep 15;248(3):741-7. doi: 10.1111/j.1432-1033.1997.t01-1-00741.x. Eur J Biochem. 1997. PMID: 9342225
-
A chondrodysplasia family produced by mutations in the diastrophic dysplasia sulfate transporter gene: genotype/phenotype correlations.Am J Med Genet. 1996 May 3;63(1):144-7. doi: 10.1002/(SICI)1096-8628(19960503)63:1<144::AID-AJMG25>3.0.CO;2-N. Am J Med Genet. 1996. PMID: 8723100 Review.
-
Skeletal Dysplasias Caused by Sulfation Defects.Int J Mol Sci. 2020 Apr 14;21(8):2710. doi: 10.3390/ijms21082710. Int J Mol Sci. 2020. PMID: 32295296 Free PMC article. Review.
Cited by
-
Regulatory mechanisms for the development of growth plate cartilage.Cell Mol Life Sci. 2013 Nov;70(22):4213-21. doi: 10.1007/s00018-013-1346-9. Epub 2013 May 4. Cell Mol Life Sci. 2013. PMID: 23640571 Free PMC article. Review.
-
Sulfated hydrogel matrices direct mitogenicity and maintenance of chondrocyte phenotype through activation of FGF signaling.Adv Funct Mater. 2016 Jun 7;26(21):3649-3662. doi: 10.1002/adfm.201600092. Epub 2016 Mar 23. Adv Funct Mater. 2016. PMID: 28919847 Free PMC article.
-
Multiple roles of the SO4(2-)/Cl-/OH- exchanger protein Slc26a2 in chondrocyte functions.J Biol Chem. 2014 Jan 24;289(4):1993-2001. doi: 10.1074/jbc.M113.503466. Epub 2013 Dec 3. J Biol Chem. 2014. PMID: 24302720 Free PMC article.
-
Microscale mapping of extracellular matrix elasticity of mouse joint cartilage: an approach to extracting bulk elasticity of soft matter with surface roughness.Soft Matter. 2018 Apr 18;14(15):2879-2892. doi: 10.1039/c7sm02045g. Soft Matter. 2018. PMID: 29582024 Free PMC article.
-
Screening and validation of 3'-Methoxydaidzein as a therapeutic agent in ulcerative colitis based on disulfidptosis-associated molecular clusters.PLoS One. 2025 Jun 6;20(6):e0324586. doi: 10.1371/journal.pone.0324586. eCollection 2025. PLoS One. 2025. PMID: 40478904 Free PMC article.
References
-
- Hästbacka J., de la Chapelle A., Mahtani M. M., Clines G., Reeve-Daly M. P., Daly M., Hamilton B. A., Kusumi K., Trivedi B., Weaver A. (1994) The diastrophic dysplasia gene encodes a novel sulfate transporter. Positional cloning by fine-structure linkage disequilibrium mapping. Cell 78, 1073–1087 - PubMed
-
- Faiyaz ul Haque M., King L. M., Krakow D., Cantor R. M., Rusiniak M. E., Swank R. T., Superti-Furga A., Haque S., Abbas H., Ahmad W., Ahmad M., Cohn D. H. (1998) Mutations in orthologous genes in human spondyloepimetaphyseal dysplasia and the brachymorphic mouse. Nat. Genet. 20, 157–162 - PubMed
-
- Thiele H., Sakano M., Kitagawa H., Sugahara K., Rajab A., Höhne W., Ritter H., Leschik G., Nürnberg P., Mundlos S. (2004) Loss of chondroitin 6-O-sulfotransferase-1 function results in severe human chondrodysplasia with progressive spinal involvement. Proc. Natl. Acad. Sci. U.S.A. 101, 10155–10160 - PMC - PubMed
-
- Hermanns P., Unger S., Rossi A., Perez-Aytes A., Cortina H., Bonafé L., Boccone L., Setzu V., Dutoit M., Sangiorgi L., Pecora F., Reicherter K., Nishimura G., Spranger J., Zabel B., Superti-Furga A. (2008) Congenital joint dislocations caused by carbohydrate sulfotransferase 3 deficiency in recessive Larsen syndrome and humero-spinal dysostosis. Am. J. Hum. Genet. 82, 1368–1374 - PMC - PubMed
Publication types
MeSH terms
Substances
Grants and funding
LinkOut - more resources
Full Text Sources
Molecular Biology Databases

