

doi: 10.1371/journal.pone.0035795.
Epub 2012 Apr 25.
Deep and clear optical imaging of thick inhomogeneous samples
Affiliations
- PMID: 22558226
- PMCID: PMC3338470
- DOI: 10.1371/journal.pone.0035795
Item in Clipboard
Deep and clear optical imaging of thick inhomogeneous samples
PLoS One.
2012.
Abstract
Inhomogeneity in thick biological specimens results in poor imaging by light microscopy, which deteriorates as the focal plane moves deeper into the specimen. Here, we have combined selective plane illumination microscopy (SPIM) with wavefront sensor adaptive optics (wao). Our waoSPIM is based on a direct wavefront measure using a Hartmann-Shack wavefront sensor and fluorescent beads as point source emitters. We demonstrate the use of this waoSPIM method to correct distortions in three-dimensional biological imaging and to improve the quality of images from deep within thick inhomogeneous samples.
Conflict of interest statement
Figures
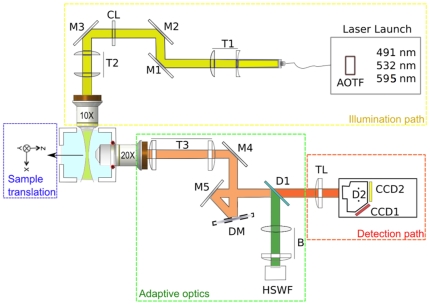
In our experimental setup (Fig. S1), a cylindrical lens focuses the light to a horizontal line (light sheet) that is imaged into the back focal plane of an illumination objective (10× NA 0.25) (yellow path). The sample is positioned in the light sheet inside a physiological chamber filled with aqueous medium. The emitted light is collected (red path) by an immersion objective (20× NA 0.5) fitted to the physiological chamber. AOTF, acousto-optic tunable filter; T1–T3, telescopes; M1–M5, mirrors; CL, cylindrical lens; DM, deformable mirror; D1 and D2, dichroic mirrors; HSWF, Hartmann–Shack wavefront sensor; B, Lens system for DM-HSWF pupil conjugation; TL, tube lens; CCD 1 and CCD2, coupled charged devices.
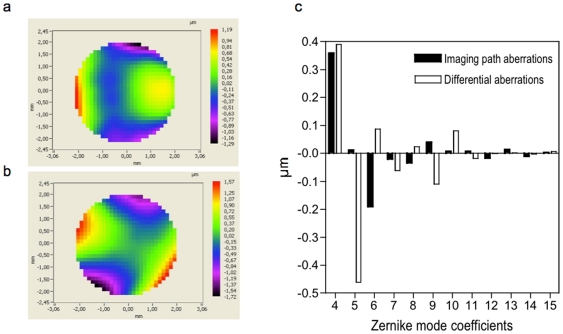
(a) Recorded wavefront in the imaging camera focal plane corresponding to the imaging path aberrations. (b) Reference recorded wavefront in the HSWF sensor path after correction of the imaging path aberrations corresponding to the differential aberrations. (c) Graph showing the 3rd and 5th order of Zernike coefficients of (a) and (b).
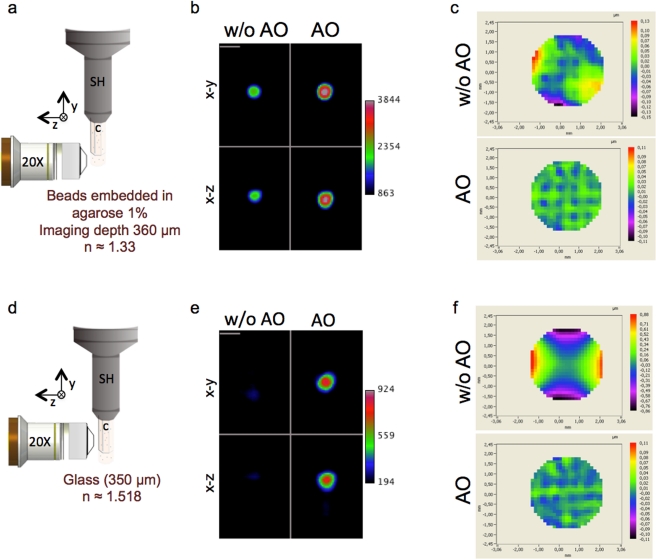
a, b and c correspond respectively to the sketch of the phantom beads geometry, the profile views and the wavefront maps for beads embedded in agarose 1% and imaged at a depth of 360 µm. d, e and f correspond respectively to the sketch of the phantom beads geometry, the profile views and the wavefront maps for beads embedded in 1% of agarose and imaged through the capillary glass at a depth of 350 µm. Images were acquired either without (w/o AO) and with AO (AO) at a fixed excitation intensity at 491 nm and a 100 ms exposure time. (a, d) In Sketches SH, sample holder; C, capillary. (b, e) Profile views without (w/o AO) and with AO (AO) of the maximum intensity projections x-y and x-z for beads either embedded in a cylinder of agarose (b), or in agarose imaged through capillary glass (e). Scale bar, 5 µm. (c, f) Wavefront maps corresponding to the raw wavefront minus reference wavefront recorded with the DM shape set to correct the optical setup aberrations (w/o AO) or with the AO closed loop (AO), the color scale correspond to the wavefront error in µm.
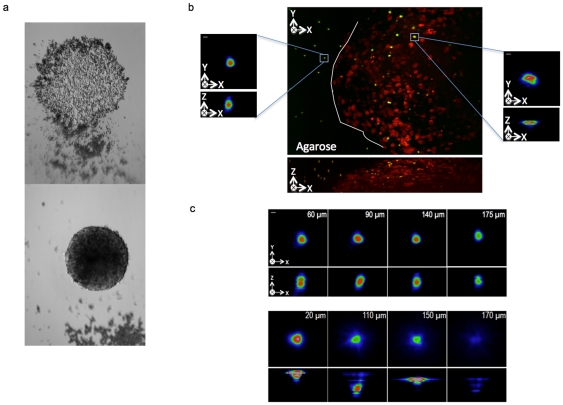
(a) Transmitted light images of cells seed with 2.5 µm green beads (InSpeck Green, I-7219, Invitrogen) in a 96- well plate (bottom image). After 4 days in culture, these cells formed a MCTS incorporating the beads (below image). (b) Maximum projection of a three-dimensional stack of 100 images (z spacing 1 µm) of a MCTS expressing a fluorescent nuclear protein, H2B–HcRed and cultivated in presence of green fluorescence beads as shown in (a). Insets show magnified views of the bead outside (left) or inside (right) the spheroid. Scale bar, 2 µm. (c) Profile views of the maximum intensity projections x-y and x-z for beads either outside (top panel), or inside the MCTS (bellow panel) imaged at different depths. Images were acquired at fixed excitation intensity at 491 nm and a 100 ms exposure time. Images share the same intensity scale. Scale bar, 2 µm.
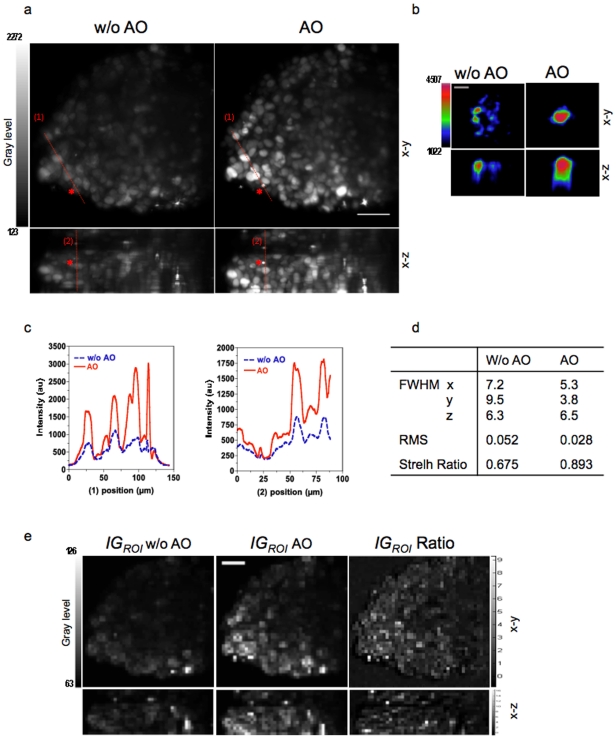
Maximum projection of a 3D stack of 100 images (z spacing 1 µm) of a large MCTS expressing a fluorescent nuclear protein, H2B–HcRed, without (w/o AO) and with AO (AO). Scale bar, 50 µm. The asterisk marks the bead used as the point source emitter located at a depth of 150 µm. Both images were acquired by using the same excitation intensity at 595 nm and a 300 ms exposure time. (b) Magnified views of the bead. Scale bar, 5 µm. (c) Intensity profiles along the lines 1 and 2 indicated in (a). (d) FWHM (µm), RMS and Strelh ratio values for bead images in (b). (e) IGROI mapping images calculated from images in (a) and IGROI Ratio image calculated as![]()
 is
is  mapping images calculated from images obtained with AO and
  is
is  mapping images calculated from images obtained without AO.
is mapping images calculated from images obtained with AO and is mapping images calculated from images obtained without AO.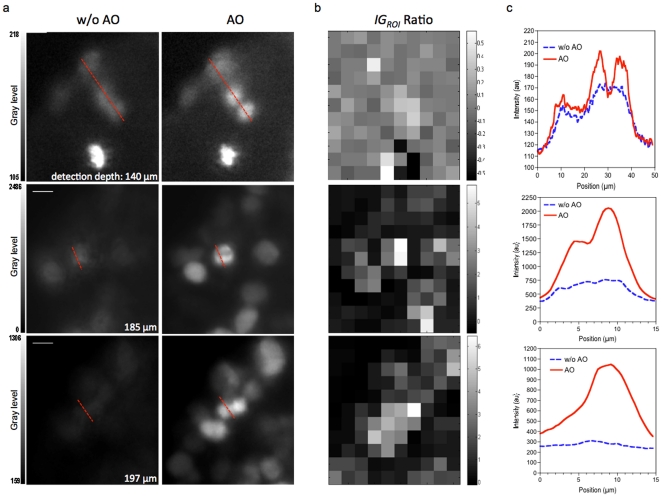
(a) Single planes images of nuclei and mitotic figures at various depths within the MCTS resolved with AO or not (w/o AO). Images are acquired by using the same excitation intensity at 595 nm and same exposure time (300 ms). Scale Bar 5 µm. (b) The corresponding IGROI Ratio image. (c) The corresponding intensity plots along the line indicated.
References
-
- Ntziachristos V. Going deeper than microscopy: the optical imaging frontier in biology. Nat Methods. 2010;7:603–614. - PubMed
-
- Huisken J, Swoger J, Del Bene F, Wittbrodt J, Stelzer EHK. Optical sectioning deep inside live embryos by selective plane illumination microscopy. Science. 2004;305:1007. - PubMed
-
- Arrenberg AB, Stainier DY, Baier H, Huisken J. Optogenetic control of cardiac function. Science. 2010;330:6006. - PubMed
Publication types
MeSH terms
LinkOut - more resources
Full Text Sources
Other Literature Sources
