

Seasonal patterns of body temperature daily rhythms in group-living Cape ground squirrels Xerus inauris
- PMID: 22558324
- PMCID: PMC3338621
- DOI: 10.1371/journal.pone.0036053
Seasonal patterns of body temperature daily rhythms in group-living Cape ground squirrels Xerus inauris
Erratum in
- PLoS One. 2012;7(8): doi/10.1371/annotation/65754bea-b508-431f-acf8-6c2a26602f28. Manjerovic, Mary-Beth [corrected to Manjerovic, Mary Beth].
Abstract
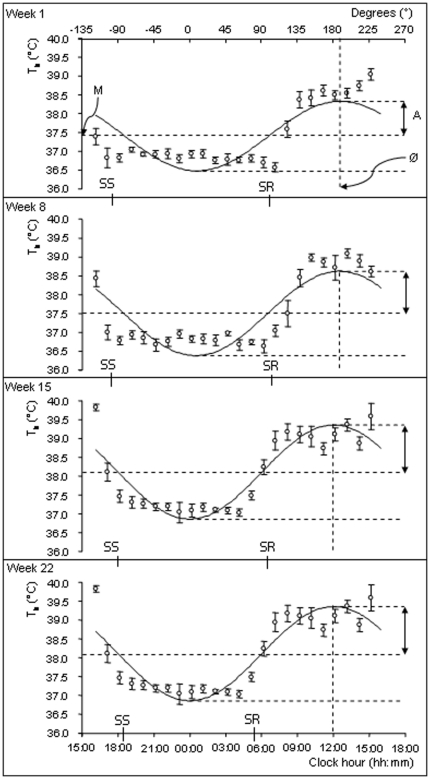
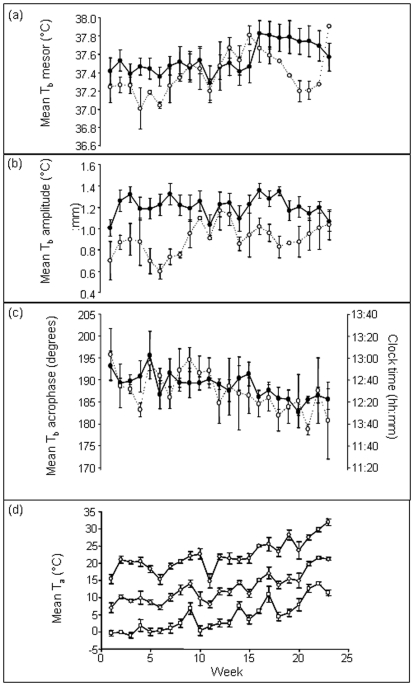
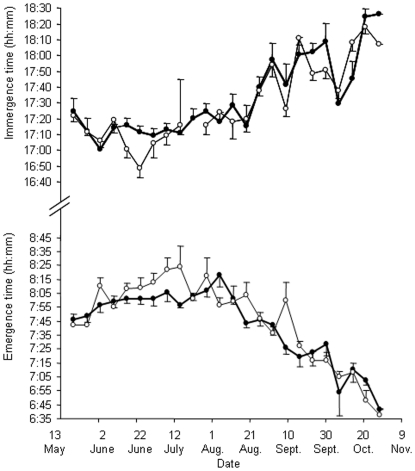
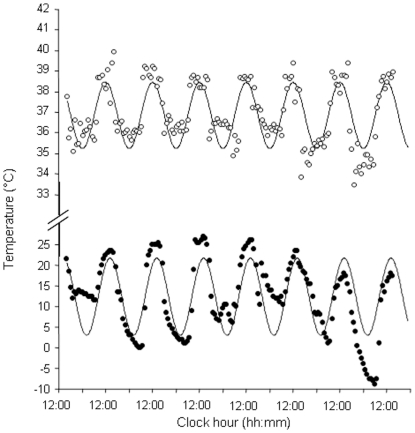
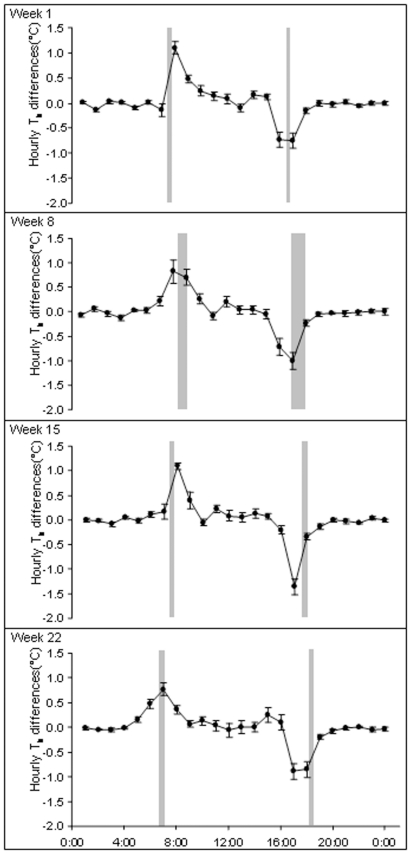
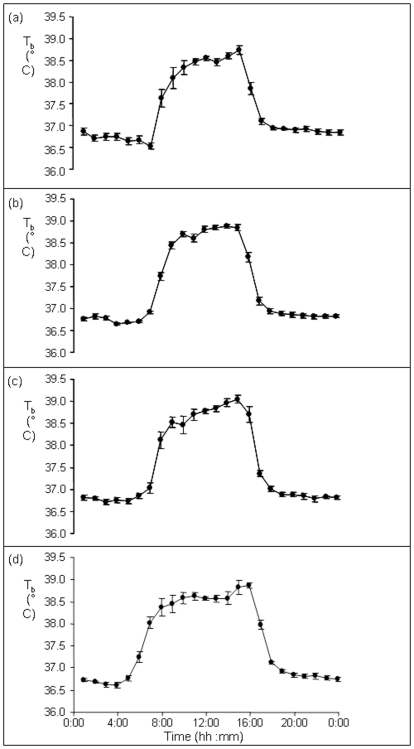
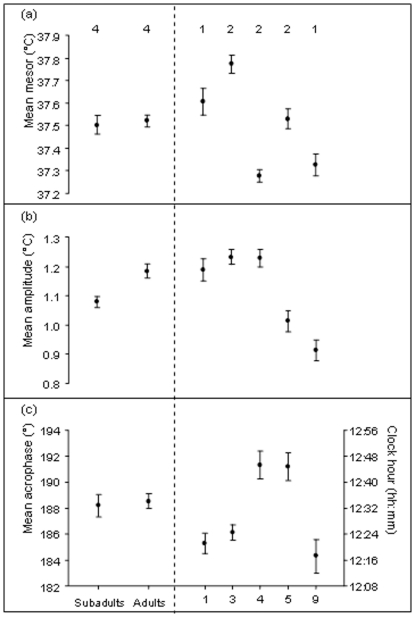
Organisms respond to cyclical environmental conditions by entraining their endogenous biological rhythms. Such physiological responses are expected to be substantial for species inhabiting arid environments which incur large variations in daily and seasonal ambient temperature (T(a)). We measured core body temperature (T(b)) daily rhythms of Cape ground squirrels Xerus inauris inhabiting an area of Kalahari grassland for six months from the Austral winter through to the summer. Squirrels inhabited two different areas: an exposed flood plain and a nearby wooded, shady area, and occurred in different social group sizes, defined by the number of individuals that shared a sleeping burrow. Of a suite of environmental variables measured, maximal daily T(a) provided the greatest explanatory power for mean T(b) whereas sunrise had greatest power for T(b) acrophase. There were significant changes in mean T(b) and T(b) acrophase over time with mean T(b) increasing and T(b) acrophase becoming earlier as the season progressed. Squirrels also emerged from their burrows earlier and returned to them later over the measurement period. Greater increases in T(b), sometimes in excess of 5°C, were noted during the first hour post emergence, after which T(b) remained relatively constant. This is consistent with observations that squirrels entered their burrows during the day to 'offload' heat. In addition, greater T(b) amplitude values were noted in individuals inhabiting the flood plain compared with the woodland suggesting that squirrels dealt with increased environmental variability by attempting to reduce their T(a)-T(b) gradient. Finally, there were significant effects of age and group size on T(b) with a lower and less variable T(b) in younger individuals and those from larger group sizes. These data indicate that Cape ground squirrels have a labile T(b) which is sensitive to a number of abiotic and biotic factors and which enables them to be active in a harsh and variable environment.
Conflict of interest statement
Figures
Similar articles
-
Winter body temperature patterns in free-ranging Cape ground squirrel, Xerus inauris: no evidence for torpor.J Comp Physiol B. 2010 Oct;180(7):1099-110. doi: 10.1007/s00360-010-0472-z. Epub 2010 Apr 16. J Comp Physiol B. 2010. PMID: 20396893
-
Hibernation and circadian rhythms of body temperature in free-living Arctic ground squirrels.Physiol Biochem Zool. 2012 Jul-Aug;85(4):397-404. doi: 10.1086/666509. Epub 2012 Jun 8. Physiol Biochem Zool. 2012. PMID: 22705489
-
Seasonal loss and resumption of circadian rhythms in hibernating arctic ground squirrels.J Comp Physiol B. 2017 Jul;187(5-6):693-703. doi: 10.1007/s00360-017-1069-6. Epub 2017 Mar 22. J Comp Physiol B. 2017. PMID: 28332018
-
Cardiovascular function in large to small hibernators: bears to ground squirrels.J Comp Physiol B. 2015 Apr;185(3):265-79. doi: 10.1007/s00360-014-0881-5. Epub 2014 Dec 27. J Comp Physiol B. 2015. PMID: 25542162 Review.
-
Survival value of suprachiasmatic nuclei (SCN) in four wild sciurid rodents.Behav Neurosci. 2014 Jun;128(3):240-9. doi: 10.1037/a0036696. Behav Neurosci. 2014. PMID: 24886187 Review.
Cited by
-
Effects of Cold-Dry (Harmattan) and Hot-Dry Seasons on Daily Rhythms of Rectal and Body Surface Temperatures in Sheep and Goats in a Natural Tropical Environment.J Circadian Rhythms. 2016 Nov 29;14:8. doi: 10.5334/jcr.143. J Circadian Rhythms. 2016. PMID: 30210554 Free PMC article.
-
The metabolic response of the Bradypus sloth to temperature.PeerJ. 2018 Sep 19;6:e5600. doi: 10.7717/peerj.5600. eCollection 2018. PeerJ. 2018. PMID: 30258712 Free PMC article.
-
The physiological role of TRP channels in sleep and circadian rhythm.J Cell Mol Med. 2024 May;28(9):e18274. doi: 10.1111/jcmm.18274. J Cell Mol Med. 2024. PMID: 38676362 Free PMC article. Review.
-
Staying Alive: Individual Behavioral Variation Influences Survival, but Not Reproductive Success, in Female Group-Living Ground Squirrels.Ecol Evol. 2025 Jul 28;15(8):e71861. doi: 10.1002/ece3.71861. eCollection 2025 Aug. Ecol Evol. 2025. PMID: 40740801 Free PMC article.
-
Living on the edge: Daily, seasonal and annual body temperature patterns of Arabian oryx in Saudi Arabia.PLoS One. 2017 Aug 30;12(8):e0180269. doi: 10.1371/journal.pone.0180269. eCollection 2017. PLoS One. 2017. PMID: 28854247 Free PMC article.
References
-
- Kenagy GJ, Vleck D. Daily temporal organization of metabolism in small mammals: adaptation and diversity. In: Aschoff J, Dean S, Groos G, editors. Vertebrate Circadian Systems. Berlin: Springer; 1982.
-
- Refinetti R. Amplitude of the daily rhythm of body temperature in eleven mammalian species. J Therm Biol. 1999;24:477–481.
-
- Aschoff J. The circadian rhythms of body temperature as a function of body size. In: Taylor CR, Johanson K, Bolis L, editors. A Companion to Animal Physiology. Cambridge: Cambridge University Press; 1982. pp. 173–188.
-
- Haim A, Rubal A. Seasonal acclimatization of daily rhythms of body temperature in two rodent species of different origins inhabiting Mediterranean woodland. Pol Ecol Stud. 1994;20:357–363.
-
- Golightly RT, Jr, Ohmart RD. Heterothermy in free ranging Albert's squirrels (Sciurus aberti). Ecology. 1978;59:897–909.
Publication types
MeSH terms
LinkOut - more resources
Full Text Sources
