. 2012 Jun 1;11(6):3053-67.
doi: 10.1021/pr3001546. Epub 2012 May 17.

Label-free quantitative LC-MS proteomics of Alzheimer's disease and normally aged human brains

Affiliations

Label-free quantitative LC-MS proteomics of Alzheimer's disease and normally aged human brains

Victor P Andreev et al. J Proteome Res. .

Abstract

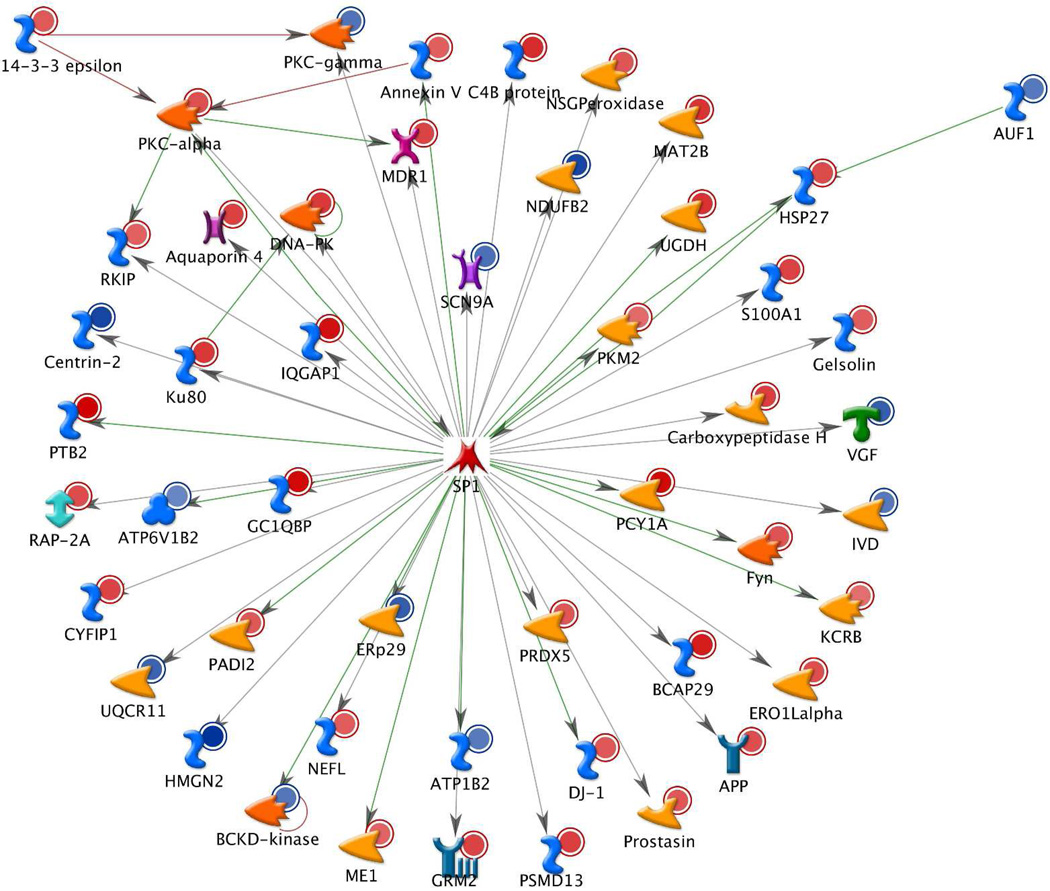
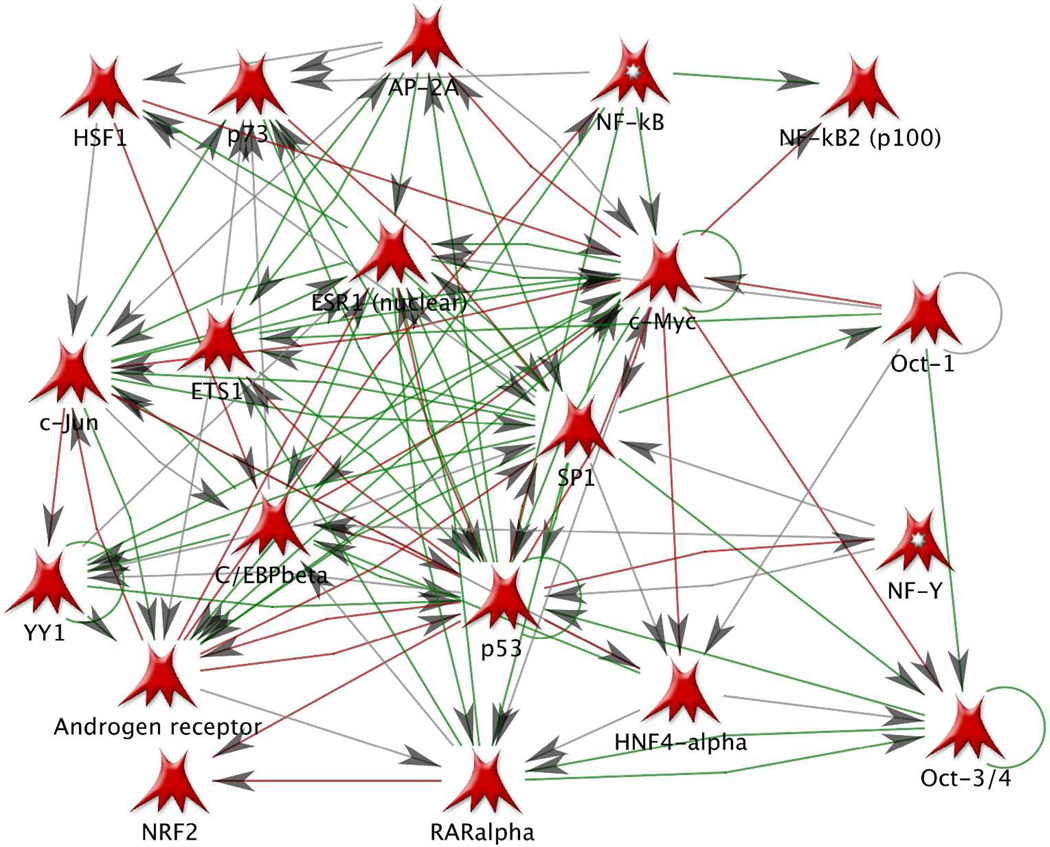
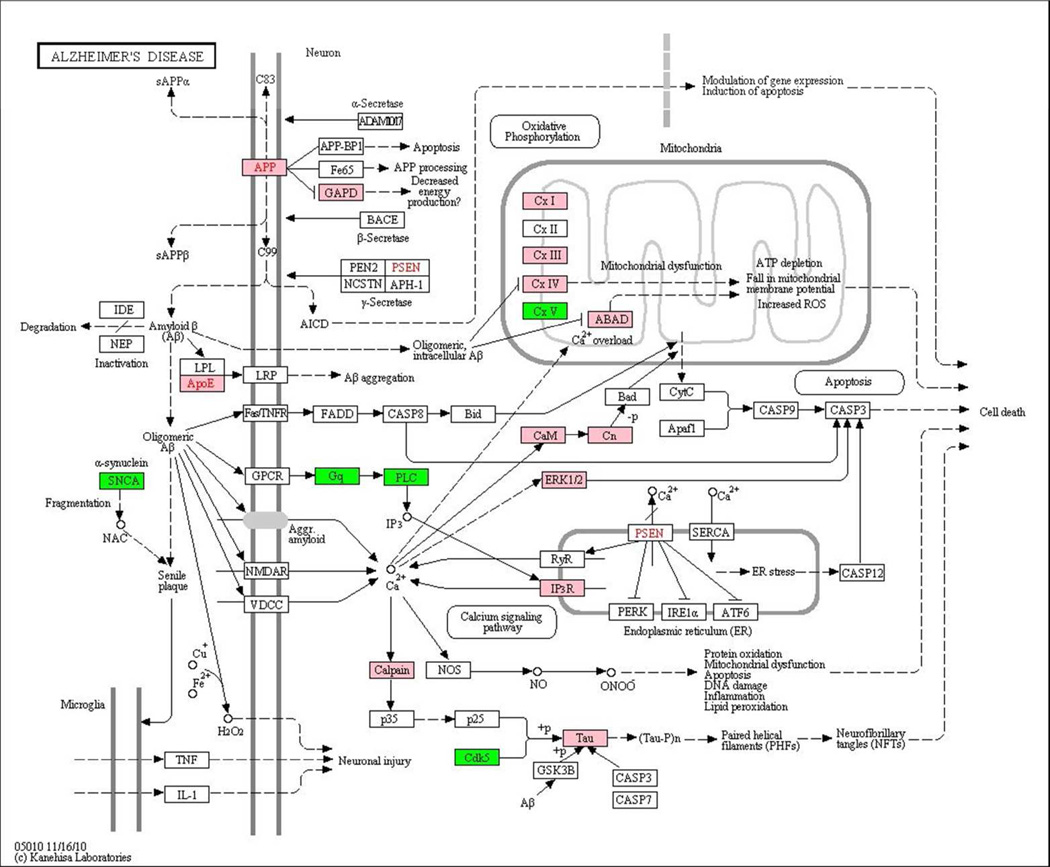
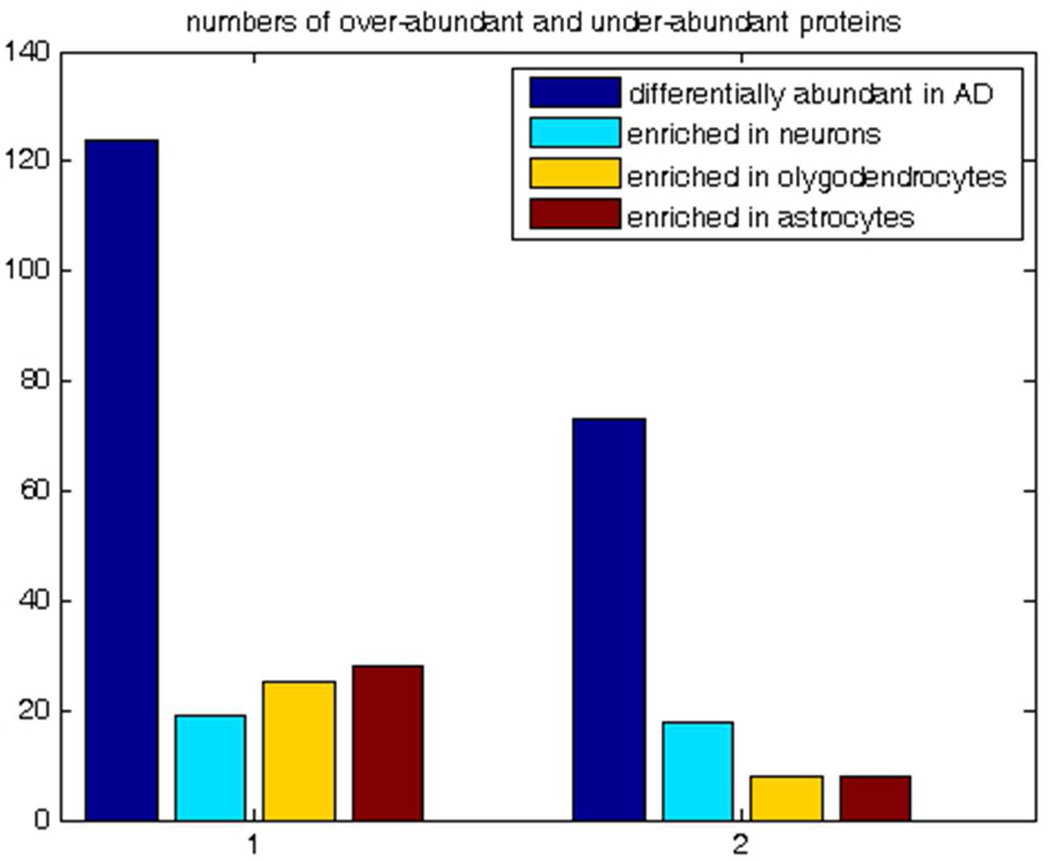
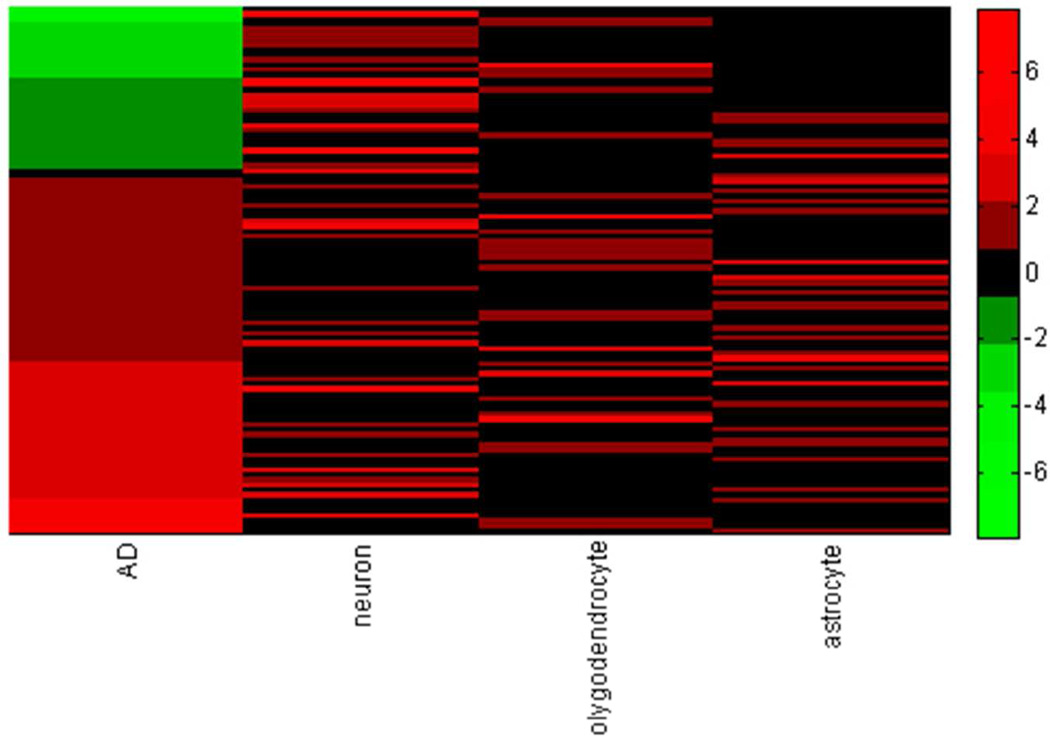
Quantitative proteomics analysis of cortical samples of 10 Alzheimer's disease (AD) brains versus 10 normally aged brains was performed by following the accurate mass and time tag (AMT) approach with the high resolution LTQ Orbitrap mass spectrometer. More than 1400 proteins were identified and quantitated. A conservative approach of selecting only the consensus results of four normalization methods was suggested and used. A total of 197 proteins were shown to be significantly differentially abundant (p-values <0.05, corrected for multiplicity of testing) in AD versus control brain samples. Thirty-seven of these proteins were reported as differentially abundant or modified in AD in previous proteomics and transcriptomics publications. The rest to the best of our knowledge are new. Mapping of the discovered proteins with bioinformatic tools revealed significant enrichment with differentially abundant proteins of pathways and processes known to be important in AD, including signal transduction, regulation of protein phosphorylation, immune response, cytoskeleton organization, lipid metabolism, energy production, and cell death.


Conflict of interest statement

Conflict of Interest

Authors declare no conflict of interest.

Figures

Figure 1
Figure 1
Histograms of distributions of peptide abundances in 10 control (top two rows) and 10 AD (bottom two rows) brain samples. Vertical axis – number of peptides. Horizontal axis : log2(Iik/mIk), where mIk=ΣIik/N – mean abundance of the given peptide across all 20 samples.
Figure 2
Figure 2
Venn diagram comparison of proteins determined as significantly differentially abundant with 3 normalization methods: VP (275 proteins), V01 (270), Eigen MS (1144). Results for V03 (not shown) are similar to V01. See details in the text.
Figure 3
Figure 3
Comparison of p-values corrected for multiplicity of testing (FDR) and abundance ratios calculated with four normalization methods. First heat map: FDR-values. Light green indicates FDR<0.05. Bottom part of the heat map – consensus significant proteins. Followed by proteins significant with two of normalization methods and then with single normalization method. Second heat map: log2(AD/C), green indicates proteins under-abundant in AD, red – over-abundant. Note that abundance ratios for consensus significant proteins are consistent across the normalization methods (green and red bands in the bottom of the map).
Figure 4
Figure 4
Validation of expression of selected proteins by western blotting. (A) Western blot gels of PKC-gamma and NUMBL in normal and Alzheimer Disease human cortices. ENO2 was used as an internal control for equal loading. (B) and (C) Densitometric analysis of PKC-gamma and NUMBL protein expression in normal versus Alzheimer Disease human cortices (n = 4 samples per group). Average normalized OD values ± SE were used to plot respective diagrams. Control normal human cortex samples: C142, C147, C148, C150. Alzheimer’s Disease human cortex samples: D171, D175, D179, D184. OD: Optical density.
Figure 5
Figure 5
The top significant transcription regulation network involving 49 out of 197 significantly differentially abundant proteins (AD versus control) determined in this study. Red circles – over-abundant proteins, blue circles - under-abundant proteins. Network map is generated with Build Network tool (option Transcription Regulation) of MetaCore 6.4 (GeneGo, Inc). See legend in Suppl . Fig. 2 for complete list of symbols. See Suppl. Report 1 for 19 more transcription networks regulating 197 differentially abundant proteins.
Figure 6
Figure 6
Network of 20 transcription factors regulating 197 significant differentially abundant proteins. Network map is generated with Build Network tool (option Direct Interactions) of MetaCore 6.4 (GeneGo, Inc). Transcription factors are closely interconnected with transcription regulation and binding interactions. Green lines – activation, red – inhibition, grey – unspecified.
Figure 7
Figure 7
Alzheimer’s Disease pathway from KEGG. The list of 1049 consensus proteins determined in our study is mapped on the Alzheimer’s disease pathway from KEGG. Over-abundant proteins are marked with pink and under-abundant with green. The differentially abundant proteins observed in our study are present in three important branches of the KEGG AD pathway (APP, APOE and Tau).
Figure 8
Figure 8
Mapping of the 197 proteins significantly differentially abundant in AD onto the mouse CNS cell type enrichment database. Fig 8A. Proteins over-abundant and under-abundant in AD and their cell type enrichment. Fig 8B. Heat map of abundance and cell type enrichment for 104 proteins common for the list of 197 significantly differentially abundant in AD and cell type enrichment database , where transcripts were considered enriched if they were at least 1.5-fold over-expressed and statistically different by significance analysis of microarrays with false discovery threshold of 1%.
Figure 8
Figure 8
Mapping of the 197 proteins significantly differentially abundant in AD onto the mouse CNS cell type enrichment database. Fig 8A. Proteins over-abundant and under-abundant in AD and their cell type enrichment. Fig 8B. Heat map of abundance and cell type enrichment for 104 proteins common for the list of 197 significantly differentially abundant in AD and cell type enrichment database , where transcripts were considered enriched if they were at least 1.5-fold over-expressed and statistically different by significance analysis of microarrays with false discovery threshold of 1%.

References

    1. Evans DA, Funkenstein HH, Albert MS, Scherr PA, Cook NR, Chown MJ, Hebert LE, Hennekens CH, Taylor JO. Prevalence of Alzheimer’s disease in a community population of older persons. Higher than previously reported. JAMA. 1989;262:2551–2556. - PubMed
    1. Gatz M, Pedersen NL, Berg S, Johansson B, Johansson K, Mortimer JA, Posner SF, Viitanen M, Winblad B, Ahlbom A. Heritability for Alzheimer’s disease: the study of dementia in Swedish twins. J Gerontol A Biol Sci Med Sci. 1997;52:M117–M125. - PubMed
    1. Risch N, Merikangas K. The future of genetic studies of complex human diseases. Science. 1996;273:1516–1517. - PubMed
    1. Papassotiropoulos A, Fountoulakis M, Dunckley T, Stephan DA, Reiman EM. Genetics, transcriptomics and proteomics of Alzheimer’s disease. J Clin Psychiatry. 2006;67:652–670. - PMC - PubMed
    1. Lovestone S, Guntert A, Hye A, Lynham S, Thambisetty M, Ward M. Proteomics of Alzheimer’s disease: understanding mechanisms and seeking biomarkers. Expert Rev Proteomics. 2007;4:227–238. - PubMed

Publication types