Review
. 2012:14:231-54.
doi: 10.1146/annurev-bioeng-071811-150025. Epub 2012 May 3.

Optical nanoscopy: from acquisition to analysis

Affiliations
Review

Optical nanoscopy: from acquisition to analysis

Travis J Gould et al. Annu Rev Biomed Eng. 2012.

Abstract

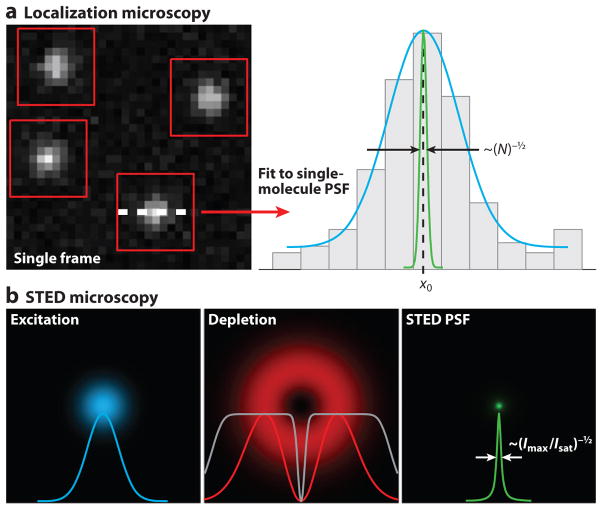
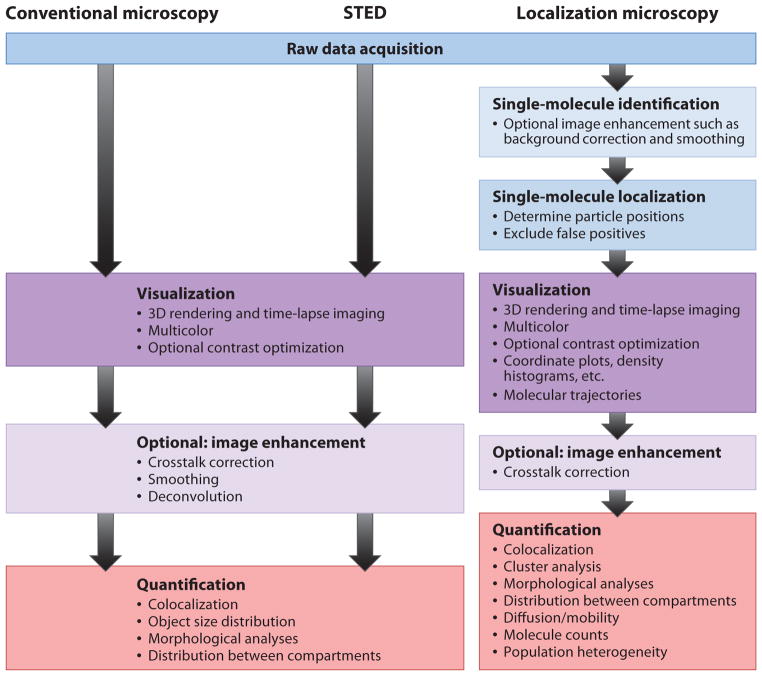
Recent advances in far-field microscopy have demonstrated that fluorescence imaging is possible at resolutions well below the long-standing diffraction limit. By exploiting photophysical properties of fluorescent probe molecules, this new class of methods yields a resolving power that is fundamentally diffraction unlimited. Although these methods are becoming more widely used in biological imaging, they must be complemented by suitable data analysis approaches if their potential is to be fully realized. Here we review the basic principles of diffraction-unlimited microscopy and how these principles influence the selection of available algorithms for data analysis. Furthermore, we provide an overview of existing analysis strategies and discuss their application.


Conflict of interest statement

DISCLOSURE STATEMENT

The authors hold patents in the field and have financial interest in Vutara, Inc.

Figures

Figure 1
Figure 1
Concepts of diffraction-unlimited microscopy. (a) Concept of localization microscopy (LM). Sparse subsets of single molecules are identified in a raw frame (red boxes). Each molecule is fitted (cyan curve) to determine its position (x0) with a precision that is inversely proportional to the square root of the number of detected photons (N), as indicated by the green curve. An LM image is generated from the coordinates of molecules localized from many frames. (b) Concept of stimulated emission depletion (STED) microscopy. The conventional excitation focus of a laser-scanning microscope (cyan) is coaligned to the donut-shaped depletion focus, which features an intensity zero at its center (red ). Saturating the depletion efficiency quenches fluorescence emission except at the center of the depletion focus ( gray curve). An effective STED point-spread function (PSF) ( green) is generated with a size that is inversely proportional to the square root of the ratio of maximum depletion intensity to characteristic saturation intensity (Imax/Isat).
Figure 2
Figure 2
Data processing in conventional and diffraction-unlimited microscopy. Abbreviation: STED, stimulated emission depletion.
Figure 3
Figure 3
Trajectories in diffraction-unlimited microscopy. (a) Trajectories of synaptic vesicles imaged at video rate by stimulated emission depletion microscopy. Adapted from Reference ; reprinted with permission from AAAS. (b) Trajectories of Dendra2-HA molecules expressed in a living fibroblast cell imaged at 37°C using localization microscopy. Inset shows zoom-in of boxed region.
Figure 4
Figure 4
Single linkage cluster analysis (SLCA) of FPALM data set to identify and characterize membrane protein clusters. (a) FPALM image of Dendra2-tagged linker of activated T cells in HAb2 fixed fibroblast cell. Examples of clusters identified by SLCA are shown in red (maximum nearest neighbor distance 30 nm). (b) Magnified view of one such cluster contained in the box in panel a. (c) List of properties that can be analyzed once the molecules constituting each cluster have been identified.
Figure 5
Figure 5
Visualization of data in diffraction-unlimited microscopy. (a) STED image of SNAP-25 on the plasma membrane of fixed neuronal cell. The area inside the blue circle has been linearly deconvolved. (b–g) A comparison of simulated LM data representing two parallel lines rendered using (b) a scatter plot of molecular coordinates, (c) Gaussian spots with standard deviation equal to the simulated localization precision (10 nm), (d ) a quad-tree-based adaptive histogram, (e) the Delaunay triangulation method, (f) randomly subsampled triangulation, and ( g) adaptively jittered and averaged triangulation. Line profiles were generated by summing data along the vertical axis. Dashed lines represent the theoretical distribution of positions. Abbreviations: LM, localization microscopy; SNAP-25, synaptosomal-associated protein 25; STED, stimulated emission depletion. Panel a from Reference ; panels b–g from Reference .
Figure 6
Figure 6
Examples of data visualization and processing in localization microscopy (LM). (a,b) Stacked visualization of several tubular membrane invaginations labeled for clathrin ( green), FBP17 (red ), and dynamin (blue). Multiple invaginations were aligned according to their clathrin and dynamin signals. (c) Plot of the localized probe positions along the tubules for 207 clathrin and FBP17 data sets. (d ) Projections and sections of a 3D data set of a single clathrin-coated pit in two orientations. Panels a–d adapted with permission from Reference . (e) Normalized K-test of PA-GFP-hemagglutinin in live and fixed fibroblasts showing clustering on length scales from ~20 nm to ~2.5 μm as indicated by the results’ being significantly above the dotted green line denoting a random distribution. Panel e reproduced with permission from Reference . ( f,g) LM image of integrin αv–tdEos. Single molecules are color-coded by their axial positions. (f) Top view. ( g) Side view of the focal adhesion denoted by the white box in panel f. The histogram shows the axial distribution (units: nm) of the molecules. Panels f and g adapted with permission from Reference . (h) Histogram of cluster sizes of Eos-Tar illustrating that smaller clusters occur much more frequently than large ones. The insets show sample cluster images and the cumulative distribution function. The red lines represent the fit to a self-assembly model. Panel h reproduced with permission from Reference .

References

    1. Hell SW. Far-field optical nanoscopy. Science. 2007;316:1153–58. - PubMed
    1. Toomre D, Bewersdorf J. A new wave of cellular imaging. Annu Rev Cell Dev Biol. 2010;26:285–314. - PubMed
    1. Abbe E. Beiträge zur Theorie des Mikroskops und der Mikroskopischen Wahrnehmung. Arch Mikrosk Anat. 1873;9:413–68.
    1. Hell SW, Wichmann J. Breaking the diffraction resolution limit by stimulated emission: stimulated-emission-depletion fluorescence microscopy. Opt Lett. 1994;19:780–82. - PubMed
    1. Hell SW. Microscopy and its focal switch. Nat Methods. 2009;6:24–32. - PubMed

Publication types

Substances

LinkOut - more resources