Randomized Controlled Trial
. 2012 May;131(5):4030-41.
doi: 10.1121/1.3701879.

Across-site patterns of modulation detection: relation to speech recognition

Affiliations
Randomized Controlled Trial

Across-site patterns of modulation detection: relation to speech recognition

Soha N Garadat et al. J Acoust Soc Am. 2012 May.

Erratum in

  • J Acoust Soc Am. 2013 Jul;134(1):715

Abstract

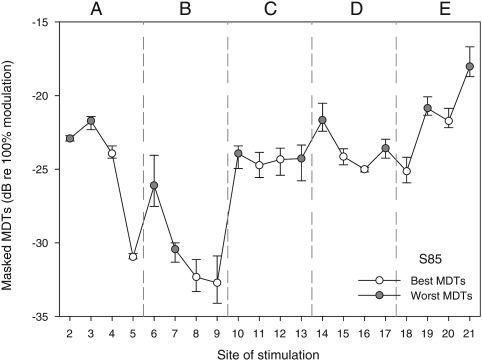
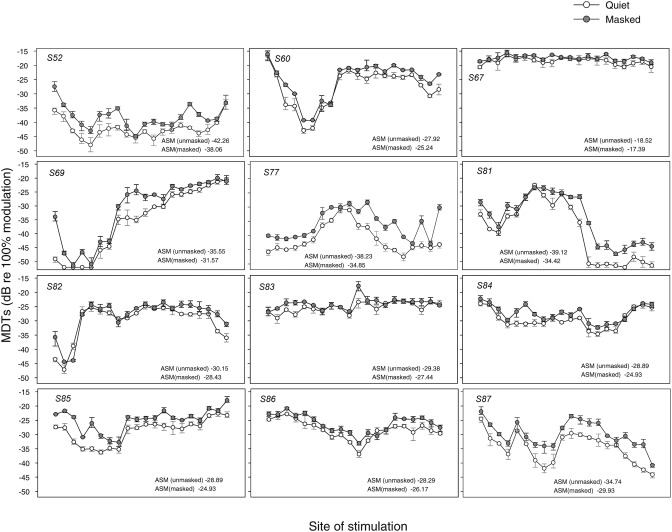
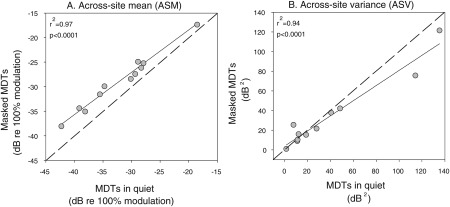
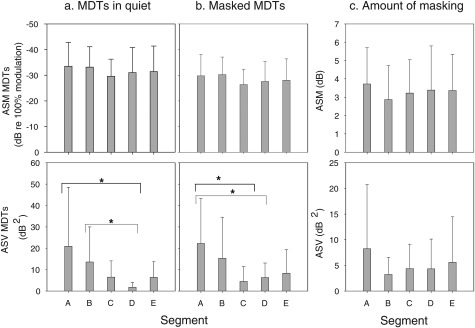
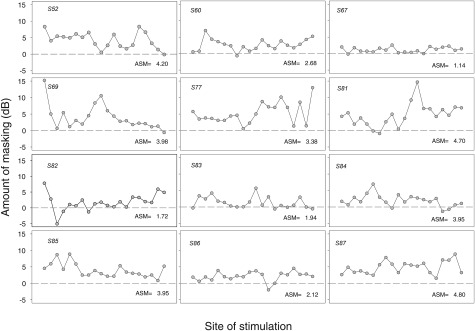
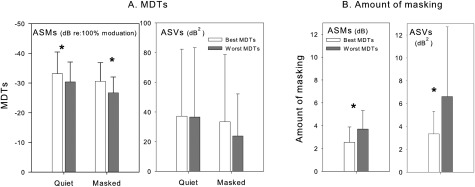
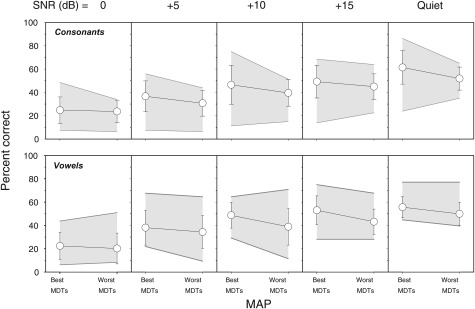
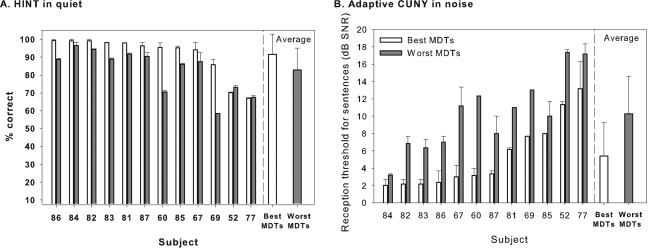
The aim of this study was to identify across-site patterns of modulation detection thresholds (MDTs) in subjects with cochlear implants and to determine if removal of sites with the poorest MDTs from speech processor programs would result in improved speech recognition. Five hundred millisecond trains of symmetric-biphasic pulses were modulated sinusoidally at 10 Hz and presented at a rate of 900 pps using monopolar stimulation. Subjects were asked to discriminate a modulated pulse train from an unmodulated pulse train for all electrodes in quiet and in the presence of an interleaved unmodulated masker presented on the adjacent site. Across-site patterns of masked MDTs were then used to construct two 10-channel MAPs such that one MAP consisted of sites with the best masked MDTs and the other MAP consisted of sites with the worst masked MDTs. Subjects' speech recognition skills were compared when they used these two different MAPs. Results showed that MDTs were variable across sites and were elevated in the presence of a masker by various amounts across sites. Better speech recognition was observed when the processor MAP consisted of sites with best masked MDTs, suggesting that temporal modulation sensitivity has important contributions to speech recognition with a cochlear implant.


Figures

Figure 1
Figure 1
Masked MDTs for stimulation sites 2-21 are displayed for one subject (S85) to demonstrate the site-selection approach used to construct the best-MDT MAP and the worst-MDT MAP. For each site, the mean MDT and the range for three repeated measures are shown. The electrode array (sites 2-21) was divided into 5 segments as shown (labeled A–E). From each segment, the two sites with the lowest (best) masked MDTs were selected to construct the best-MDT MAP (open symbols). In contrast, two electrodes with the highest (worst) masked MDTs were selected from each segment to construct the worst-MDT MAP (filled symbols).
Figure 2
Figure 2
MDT means and ranges are shown as a function of stimulation site. Each panel represents data from one subject with subject numbers shown in the upper left corner of each panel. Open symbols represent MDTs in quiet, and filled symbols represent MDTs in the presence of a masker on the adjacent apical electrode. Across-site means (ASM) are calculated separately for MDTs in quiet and masked MDTs and displayed for each subject in the lower right corners of the panels. Larger negative values indicate better performance.
Figure 3
Figure 3
Scatter plots are shown to illustrate the correlation in ASMs (left-hand panel) and ASVs (right-hand panel) between the MDTs in quiet (x axis) and masked MDTs (y axis) for each listener. The solid lines are best fit linear regression lines; r2 and P values are shown in the upper left corners of the panels. In (A), all points are slightly above the dashed diagonal line, indicating that ASM masked MDTs were a little higher in all subjects than ASM MDTs in quiet.
Figure 4
Figure 4
ASMs and ASVs of MDTs are plotted as a function of place of stimulation. The electrode array was divided into 5 segments of four electrodes in each segment as shown in Fig. 1. ASM (upper panels) and ASV (bottom panels) are shown for MDTs in quiet (a), masked MDTs (b), and amount of masking (c). An asterisk represents a statistically significant difference (P < 0.05). The error bars represent standard deviations.
Figure 5
Figure 5
The amount of masking in decibels (masked MDT minus MDT in quiet) is shown as a function of stimulation site. Each subject is represented in a different panel. The dashed line indicates no differences in MDTs when a masker was present; a positive value indicates an increase in MDTs in the presence of an interleaved masker on the adjacent site. ASM amount of masking is given for each subject at the lower right corner of each panel.
Figure 6
Figure 6
ASM and ASV for MDTs (A) and amount of masking (B) are compared for the two sets of electrodes that were selected to construct the best-MDT MAP and the worst-MDT MAP. An asterisk represents a statistically significant difference between the two MAPs at P value of 0.05. The error bars represent standard deviations.
Figure 7
Figure 7
Average discrimination percent correct scores for consonants (upper panels) and vowels (bottom panels) are shown as a function MAP. The shaded area represents the range of the scores across the 12 listeners. From left to right, the panels show discrimination scores as a function of increasing signal-to-noise ratio (SNR) in dB. The error bars represent standard deviations.
Figure 8
Figure 8
Listeners’ performance on sentence discrimination tasks is shown for HINT sentences in quiet (A) and for CUNY sentences in noise with adaptive SNRs (B). In (A), percent correct is measured and, therefore, the greater the score, the better the performance. In (B), reception thresholds for sentences are measured in decibel SNR, and hence, the smaller the number, the better the performance. Individual data as well as averages across all subjects are compared here for the best-MDT MAPs (light bars) and the worst-MDT MAPs (dark bars); error bars represent the range. Across-subject mean are shown in the right-hand portion of each panel; the error bars represent standard deviations.

Comment in

References

    1. Bierer, J. A., and Faulkner, K. F. (2010). “Identifying cochlear implant channels with poor electrode-neuron interface: Partial tripolar, single-channel thresholds and psychophysical tuning curves,” Ear Hear. 31, 247–258.10.1097/AUD.0b013e3181c7daf4 - DOI - PMC - PubMed
    1. Boëx, C., Kos, M. I., and Pelizzone, M. (2003). “Forward masking in different cochlear implant systems,” J. Acoust. Soc. Am. 114, 2058–2065.10.1121/1.1610452 - DOI - PubMed
    1. Cazals, Y., Pelizzone, M., Saudan, O., and Boëx, C. (1994). “Low-pass filtering in amplitude modulation detection associated with vowel and consonant identification in subjects with cochlear implants,” J. Acoust. Soc. Am. 96, 2048–2054.10.1121/1.410146 - DOI - PubMed
    1. Chatterjee, M. (2003). “Modulation masking in cochlear implant listeners: Envelope versus tonotopic components,” J. Acoust. Soc. Am. 113, 2042–2053.10.1121/1.1555613 - DOI - PubMed
    1. Chatterjee, M., and Shannon, R. V. (1998). “Forward masked excitation patterns in multielectrode electrical stimulation,” J. Acoust. Soc. Am. 103, 2565–2572.10.1121/1.422777 - DOI - PubMed

Publication types

MeSH terms