. 2012 Apr;17(4):047005.
doi: 10.1117/1.JBO.17.4.047005.

In vivo measurement of the shape of the tissue-refractive-index correlation function and its application to detection of colorectal field carcinogenesis

Affiliations

In vivo measurement of the shape of the tissue-refractive-index correlation function and its application to detection of colorectal field carcinogenesis

Andrew J Gomes et al. J Biomed Opt. 2012 Apr.

Erratum in

  • J Biomed Opt. 2012 May;17(5):059801

Abstract

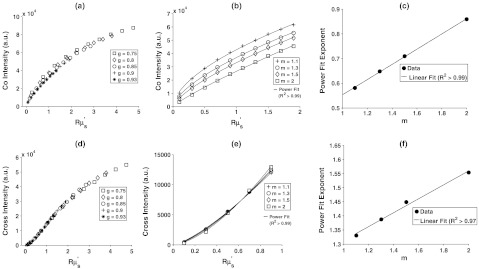
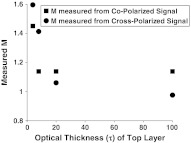
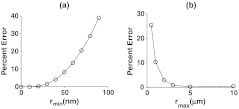
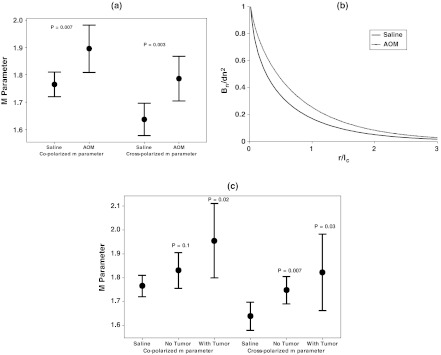
Polarization-gated spectroscopy is an established method to depth-selectively interrogate the structural properties of biological tissue. We employ this method in vivo in the azoxymethane (AOM)-treated rat model to monitor the morphological changes that occur in the field of a tumor during early carcinogenesis. The results demonstrate a statistically significant change in the shape of the refractive-index correlation function for AOM-treated rats versus saline-treated controls. Since refractive index is linearly proportional to mass density, these refractive-index changes can be directly linked to alterations in the spatial distribution patterns of macromolecular density. Furthermore, we found that alterations in the shape of the refractive-index correlation function shape were an indicator of both present and future risk of tumor development. These results suggest that noninvasive measurement of the shape of the refractive-index correlation function could be a promising marker of early cancer development.


Figures

Fig. 1
Fig. 1
Endoscopic images of a normal saline control (a) and an AOM-treated rat with a tumor (b).
Fig. 2
Fig. 2
Extraction of the index correlation-function shape (m) from the copolarized intensity (top row) and crosspolarized intensity (bottom row). (a) For g>0.85, the intensity is a function of and independent of g. A power law can be fit to this dependence for different m as shown in (b). The exponent of the power law has a linear relationship with m as shown in (c). (d–f) are analogous to (a–c) but for the crosspolarized intensity rather than copolarized intensity.
Fig. 3
Fig. 3
Depth-selective extraction of index correlation shape (m) from a dual-layer Monte Carlo model. The top layer has m=1.1 and bottom layer an m of 1.7. The m values from the copolarized and crosspolarized signals are recorded as the optical thickness (τ) of the top layer is varied. For 5<τ<15, the copolarized m parameter is sensitive to the top layer and the crosspolarized m parameter is sensitive to the bottom layer.
Fig. 4
Fig. 4
Length-scale sensitivity of index correlation function shape (m) measurement. (a) Percent between measured and input m values after correlation function was truncated at a particular rmin value. (b) Percent error between measured and input m values after index correlation function was perturbed at various rmax values according to Eq. (9).
Fig. 5
Fig. 5
The shape of the index correlation function is sensitive to concurrent and future risk of neoplasia in the AOM-treated rat. (a) Comparison of the m values from the copolarized and crosspolarized signals for saline versus all AOM-treated rats shows a statistical significant increase in m (P value=0.007 and 0.003). (b). Comparison of the shape of index correlation function shape between saline and AOM-treated rats. (c). Comparison of m values between saline controls and AOM-treated rats who had and had not developed tumors at the 18-week measurement point. The m value is highest for rats harboring a tumor but is also significant for AOM rats that had not yet developed a tumor. Solid circle points are group means and error bars are 95% CI.

References

    1. Siegel R., et al. , “Cancer statistics, 2011: the impact of eliminating socioeconomic and racial disparities on premature cancer deaths,” CA Cancer J. Clin.. 61(4), 212–236 (2011).CAMCAM10.3322/caac.v61:4 - DOI - PubMed
    1. “Screening for colorectal cancer: U.S. Preventive Services Task Force recommendation statement,” Ann. Intern. Med. 149(9), 627–637 (2008).AIMEAS - PubMed
    1. van Rijn J. C., et al. , “Polyp miss rate determined by tandem colonoscopy: a systematic review,” Am. J. Gastroenterol. 101(2), 343–350 (2006).AJGAAR10.1111/ajg.2006.101.issue-2 - DOI - PubMed
    1. Roy H. K., Backman V., Goldberg M. J., “Colon cancer screening: the good, the bad, and the ugly,” Arch. Intern. Med. 166(20), 2177–2179 (2006).AIMDAP10.1001/archinte.166.20.2177 - DOI - PubMed
    1. Imperiale T. F., et al. , “Fecal DNA versus fecal occult blood for colorectal-cancer screening in an average-risk population,” N. Engl. J. Med. 351(26), 2704–2714 (2004).NEJMAG10.1056/NEJMoa033403 - DOI - PubMed