. 2012 May 11;149(4):923-35.
doi: 10.1016/j.cell.2012.03.034. Epub 2012 May 3.

Inhibition of SRGAP2 function by its human-specific paralogs induces neoteny during spine maturation

Affiliations

Inhibition of SRGAP2 function by its human-specific paralogs induces neoteny during spine maturation

Cécile Charrier et al. Cell. .

Abstract

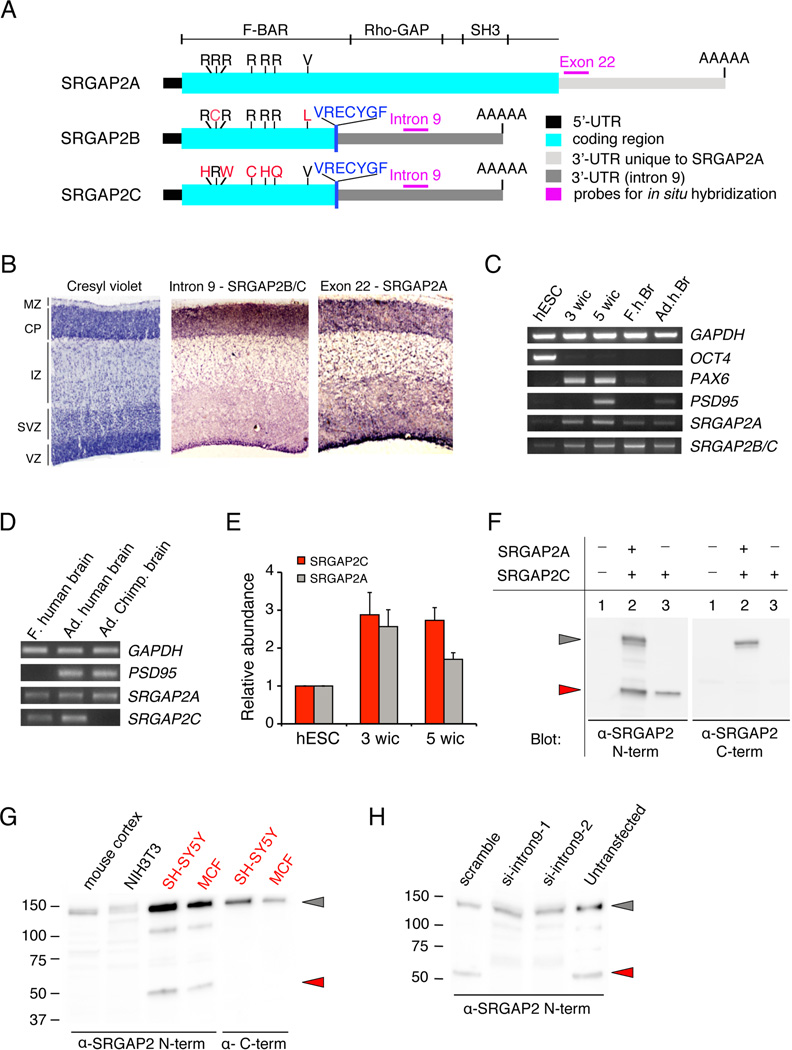
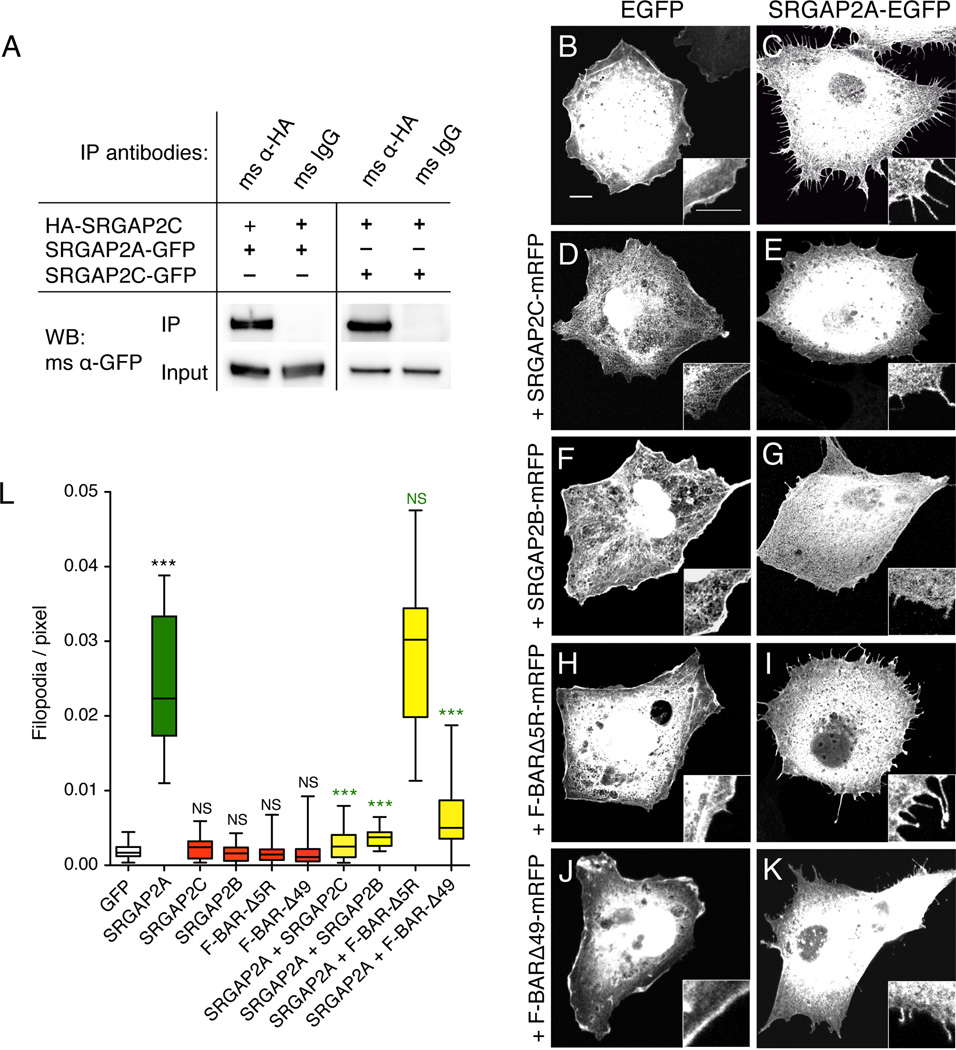
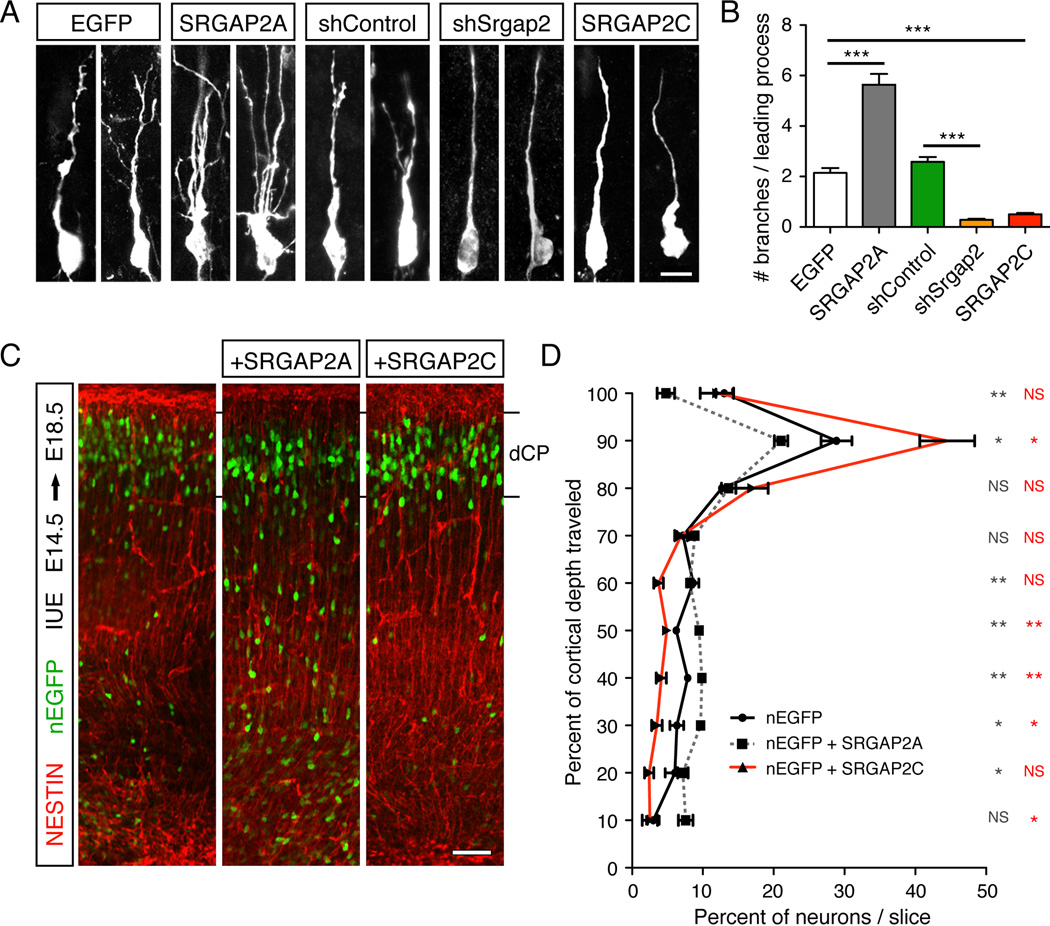
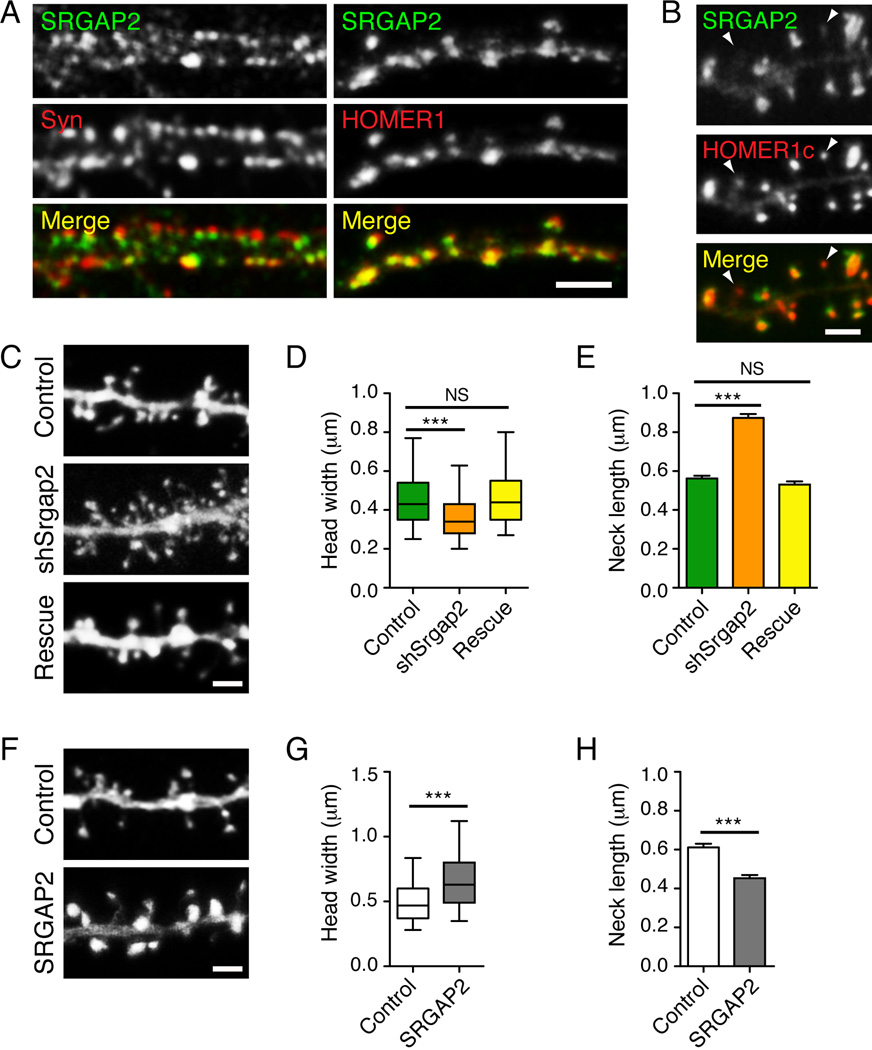
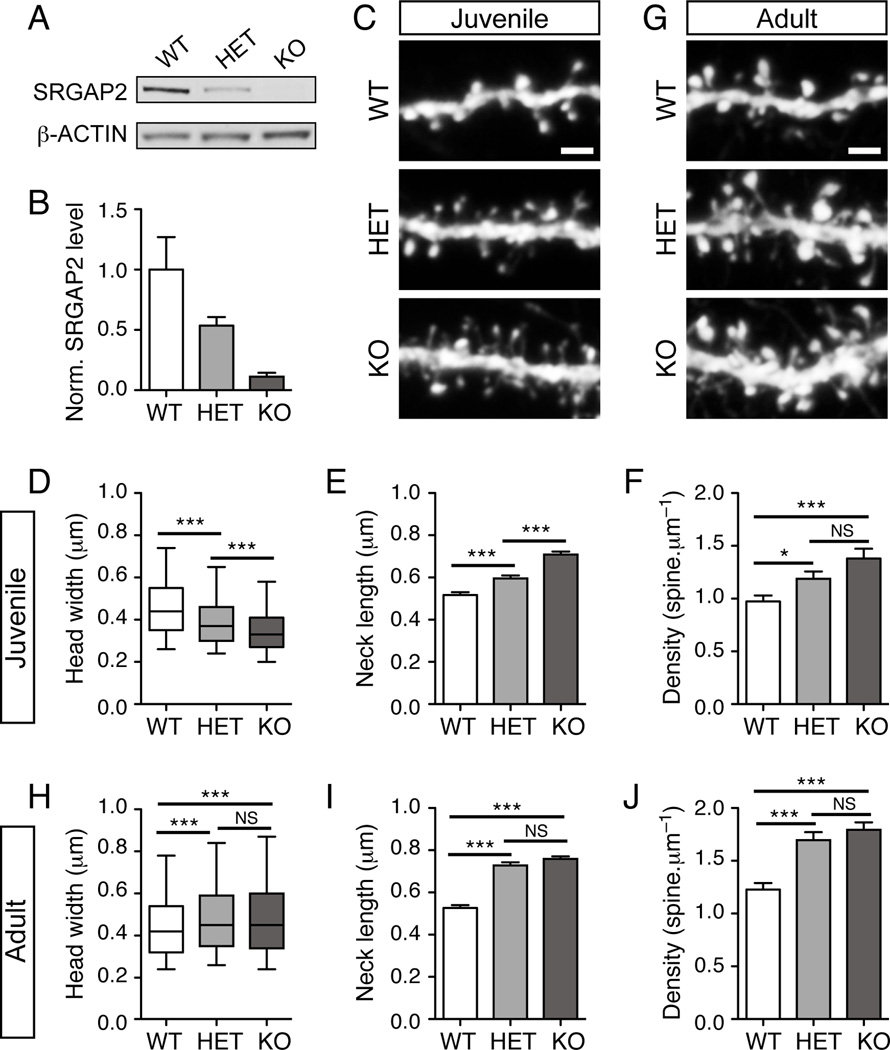
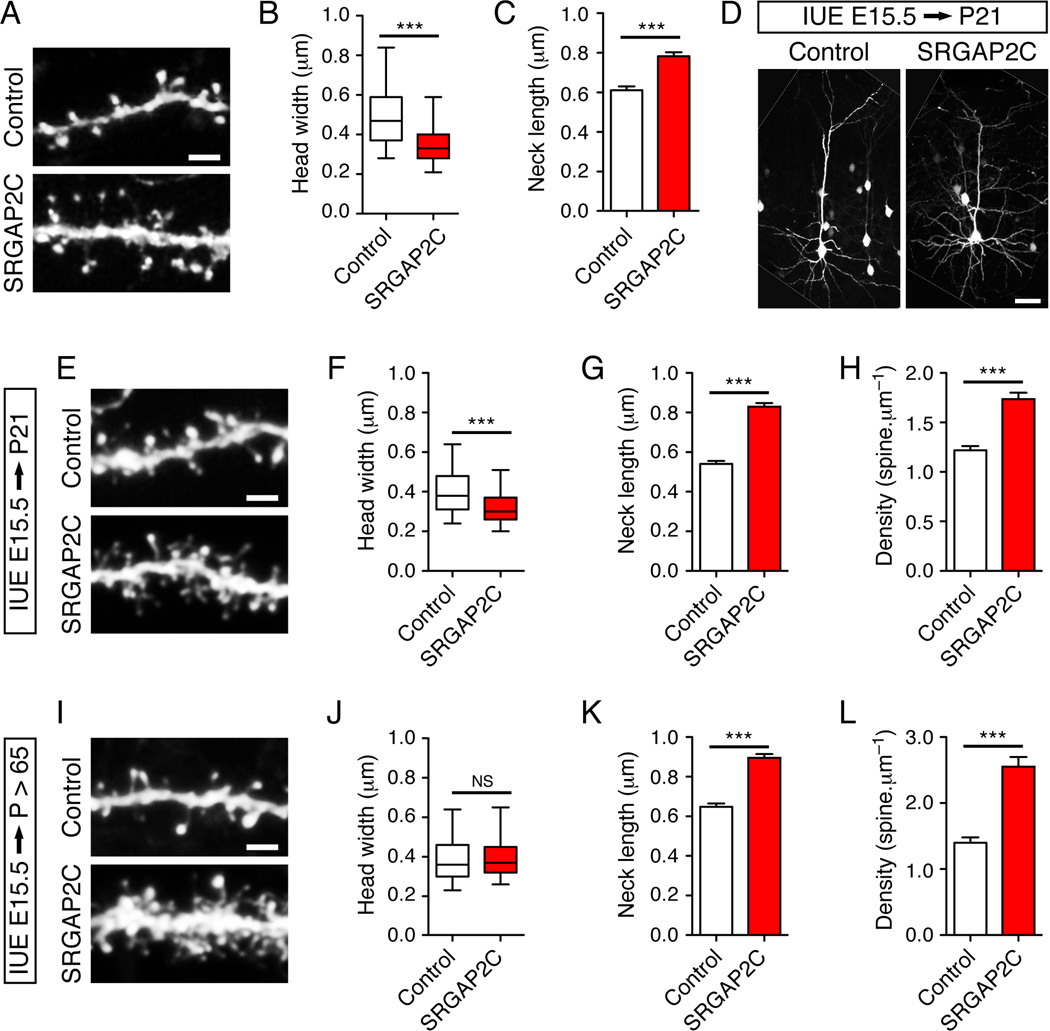
Structural genomic variations represent a major driving force of evolution, and a burst of large segmental gene duplications occurred in the human lineage during its separation from nonhuman primates. SRGAP2, a gene recently implicated in neocortical development, has undergone two human-specific duplications. Here, we find that both duplications (SRGAP2B and SRGAP2C) are partial and encode a truncated F-BAR domain. SRGAP2C is expressed in the developing and adult human brain and dimerizes with ancestral SRGAP2 to inhibit its function. In the mouse neocortex, SRGAP2 promotes spine maturation and limits spine density. Expression of SRGAP2C phenocopies SRGAP2 deficiency. It underlies sustained radial migration and leads to the emergence of human-specific features, including neoteny during spine maturation and increased density of longer spines. These results suggest that inhibition of SRGAP2 function by its human-specific paralogs has contributed to the evolution of the human neocortex and plays an important role during human brain development.


Figures

Figure 1
Figure 1. SRGAP2 and its human-specific paralogs are expressed in human neurons
(A) Schematic representation of transcripts of the three paralogs of SRGAP2. SRGAP2B and SRGAP2C encode a truncated F-BAR domain with non-synonymous mutations marked in red. VRECYGF denotes C-terminal amino-acid residues translated from intron 9 unique to SRGAP2B and SRGAP2C. (B) RNA in situ hybridization on developing human cortex at Gestational Week (GW) 11 using probes specific for SRGAP2B and SRGAP2C (intron 9) and SRGAP2A (exon 22). Cresyl violet marks the cortical layers: VZ (ventricular zone), ISVZ & OSVZ (Inner & Outer Sub-Ventricular Zone, respectively), IZ (Intermediate Zone), CP (Cortical Plate), MZ (Marginal Zone). (C) RT-PCR showing that SRGAP2A and SRGAP2B and SRGAP2C are expressed in OCT4+ human ES cells (hESC), neurons derived from hESCs following 3 weeks (PAX6+, PSD95−) or 5 weeks (PSD95+) in culture (wic) as well as fetal human brain, (F.h.br) and Adult human brain (Ad.h.Br). (D) RT-PCR performed on RNA from fetal (f.) human brain, adult (Ad.) human brain and adult chimpanzee (Ad. Chimp) brain samples. SRGAP2A primers detect the ancestral copy in human and chimp samples. SRGAP2C primers show an amplification band specifically in the human samples indicating stringency of primer hybridization only to SRGAP2C variant. (E) Quantitative-RT-PCR showing relative abundance of SRGAP2C and SRGAP2A in samples corresponding to lanes 1, 2 and 3 in panel C normalized to levels of GAPDH (mean ± s.d.; standard deviation from 2 technical replicates). (F) Full length SRGAP2A detected by Western blotting with anti (α)-SRGAP2 N-terminal or anti-SRGAP2 C-terminal antibodies when transfected in HEK293T cells (grey arrowhead). The anti-SRGAP2 N-term, but not the anti-SRGAP2 C-terminal antibody can detect SRGAP2C (red arrowhead). (G) A translation product corresponding to human-specific paralogs SRGAP2B or SRGAP2C in size (50kDa; red arrowhead) is seen in human cell lines SH-SY5Y and MCF7 but not in mouse developing cortex or cell line NIH3T3, only upon Western blotting with anti-SRGAP2 N-terminal antibody, not with anti-SRGAP2 C-terminal antibody. (H) Western blotting with anti-SRGAP2 N-terminal antibody showing knock-down of endogenous SRGAP2B or SRGAP2C but not ancestral SRGAP2A by siRNA against intron 9 (si-intron9-1 and -2; lane 2,3) in SH-SY5Y cells.
Figure 2
Figure 2. SRGAP2C dimerizes with SRGAP2A and inhibits its membrane deformation properties in COS7 cells
(A) Co-immunoprecipitation (Co-IP) of SRGAP2A-GFP or SRGAP2C-GFP along with HA-SRGAP2C in HEK293T cells transfected with the indicated constructs. Co-IP was performed using mouse anti-HA antibody and mouse IgG as negative control. Western blotting (WB) was performed with a mouse (ms) anti (α)-GFP antibody. (B–K) Representative confocal images of COS7 cells transfected with indicated constructs and visualized by EGFP signal. Scale bar: 5 µm. Inset shows 2-fold magnification. (L) Box plot showing quantification of the number of filopodia per pixel along cell periphery, for cells represented in B–K. n = 20 cells per condition. *** p<0.001, Mann-Whitney test.
Figure 3
Figure 3. SRGAP2C expression in radially migrating mouse cortical neurons phenocopies Srgap2 knock-down
(A) Confocal images of optically isolated neurons showing representative morphologies of radially migrating cortical neurons in E18.5 embryos following in utero electroporation (IUE) at E14.5 of the indicated constructs. sh stands for short hairpin. Scale bar: 10 µm. (B) Mean number of branches (± standard error to the mean; s.e.m) of the leading process of neurons as represented in panel A. n=3 animals/condition, 100–150 neurons/condition. (C) Low magnification confocal images of E18.5 cortical slices showing migration of in utero electroporated neurons expressing nuclear-EGFP (nEGFP) alone or together with SRGAP2A or SRGAP2C. Staining with anti-GFP antibody shows the position of the electroporated neurons, and anti-NESTIN antibody marks the radial glial scaffold. dCP is dense Cortical Plate. (D) Quantification of neuron distribution in cortical slices as illustrated in panel C (mean ± s.e.m). n=3 animals/condition, 9–10 slices/condition. In panels B and D, * p < 0.05; ** p < 0.005; *** < 0.0001; NS (Not significant, p>0.05); Mann-Whitney test.
Figure 4
Figure 4. SRGAP2 is accumulated at excitatory synapses and promotes spine head growth in cultured cortical neurons
(A) Segments of dendrites from cortical neurons (20 days in vitro) stained for SRGAP2 and the presynaptic marker SYNAPSIN1 (Syn) (left) or SRGAP2 and the excitatory postsynaptic marker HOMER1 (right). Scale bar: 5 µm. (B) When over-expressed, SRGAP2-RFP localized to the head of dendritic spines and largely co-localized with the excitatory postsynaptic marker HOMER1c-GFP. Note that SRGAP2 was barely detectable in spines with small HOMER1c clusters (arrowheads). (C) Segments of dendrites from cortical neurons expressing a control shRNA (Control), a shRNA targeting mouse Srgap2 (shSrgap2) and shSrgap2 co-expressed with SRGAP2A, which is resistant to this shRNA (rescue). Neurons were transfected 11 days after plating and imaged 9 days after transfection. (D) Box plot showing the distribution of the width of spine heads in knock-down experiments. nControl = 1537, nshSrgap2 = 1261, nrescue = 910. (E) Mean length of spine necks in knock-down experiments (± s.e.m). (F) Segments of dendrites from cortical neurons expressing GFP alone (control), or GFP with ancestral SRGAP2 (SRGAP2). Neurons were transfected 17–18 days after plating and imaged 2 days after transfection. (G) Distribution of the width of spine heads in gain-of-function experiments. nControl = 907, nSRGAP2 = 1020. (H) Mean length of spine necks in gain-of-function experiments (± s.e.m). In panels B, C and F, scale bars represent 2 µm. ***p < 0.001, NS (not significant): p > 0.05, Mann-Whitney test. Data are from a minimum of three independent experiments.
Figure 5
Figure 5. SRGAP2 deficiency delays spine maturation and increases spine density in vivo
(A) Representative Western blot showing the relative amount of SRGAP2 in cortical lysates of wild-type (WT), heterozygous (HET) and knock-out (KO) mice. (B) Quantification of SRGAP2 level in cortical lysates from 3 different animals per genotype normalized (norm.) to β-ACTIN and to the average SRGAP2 level in WT. (C–F) Dose-dependent effect of SRGAP2 deficiency in juvenile mice (P18–P21). (C) Segments of oblique dendrites from WT, HET and KO mice expressing YFP in layer V pyramidal neurons (Thy1-YFP H line). (D) Distribution of spine head widths, nWT = 1278, nHET = 1307, nKO = 1602. (E) Mean spine neck length (± s.e.m). (F) Mean spine density (± s.e.m). nWT = 26, nHET = 20, nKO = 28. (G–J) Long-term effect of SRGAP2 deficiency on dendritic spines. (G) Segments of oblique dendrites from adult (P65–P77) WT, HET and KO mice expressing YFP in layer V pyramidal neurons (Thy1-YFP H line). (H) Distribution of spine head widths in adult neurons, nWT = 1394, nHET = 1441, nKO = 2010. (I) Mean spine neck length in adult neurons (± s.e.m). (J) Mean spine density (± s.e.m). nWT = 23, nHET = 23, nKO = 35. Scale bars: 2 µm. ***p < 0.001, NS: p > 0.05, Mann-Whitney test.
Figure 6
Figure 6. SRGAP2C expression in mouse cortical neurons phenocopies SRGAP2 deficiency in spines
(A–C) SRGAP2C expression induces long thin spines in cultured cortical neurons. (A) Segment of dendrites from cortical neurons (20DIV) expressing EGFP alone (Control), or EGFP and SRGAP2C (SRGAP2C). Neurons were imaged 2 days after transfection. (B) Box plot representing the distribution of the width of spine heads. nControl = 907 (same as Figure 4F–H), nSRGAP2C = 1029. (C) Mean length of spine necks (± s.e.m). (D–H) Effect of SRGAP2C expression in juvenile mice in layer 2/3 pyramidal neurons following in utero electroporation (IUE) at E15.5. (D) Representative layer 2/3 pyramidal neurons expressing a control cDNA (Control, left) or SRGAP2C (right) with a vector encoding mVenus. The white lines delineate the border of the original images. (E) Segments of oblique dendrites from neurons in the conditions described above. (F) Distribution of spine head widths, nControl = 1068, nSRGAP2C = 1167. (G) Mean spine neck length (± s.e.m). (H) Mean spine density (± s.e.m). nControl = 16, nSRGAP2C = 16. (I–L) Long-term effect of SRGAP2C expression on spines in adult mice. (I) Segments of oblique dendrites from control and SRGAP2C-expressing neurons after in utero electroporation at E15.5. (J) Distribution of spine head widths, nControl = 800, nSRGAP2C = 941. (K) Mean spine neck length (± s.e.m). (L) Mean spine density (± s.e.m). nControl = 14, nSRGAP2C = 12. Scale bars represent 2 µm in panels A, E and I and 50 µm in panel D. *** p < 0.001, NS : p > 0.05, Mann-Whitney test.

Comment in

References

    1. Araya R, Jiang J, Eisenthal KB, Yuste R. The spine neck filters membrane potentials. Proceedings of the National Academy of Sciences of the United States of America. 2006;103:17961–17966. - PMC - PubMed
    1. Arellano JI, Benavides-Piccione R, Defelipe J, Yuste R. Ultrastructure of dendritic spines: correlation between synaptic and spine morphologies. Front Neurosci. 2007;1:131–143. - PMC - PubMed
    1. Bacon C, Endris V, Rappold G. Dynamic expression of the Slit-Robo GTPase activating protein genes during development of the murine nervous system. The Journal of comparative neurology. 2009;513:224–236. - PubMed
    1. Bailey JA, Eichler EE. Primate segmental duplications: crucibles of evolution, diversity and disease. Nature reviews Genetics. 2006;7:552–564. - PubMed
    1. Bailey JA, Gu Z, Clark RA, Reinert K, Samonte RV, Schwartz S, Adams MD, Myers EW, Li PW, Eichler EE. Recent segmental duplications in the human genome. Science. 2002;297:1003–1007. - PubMed

Publication types

Substances

Associated data