. 2012 May 4;10(5):520-30.
doi: 10.1016/j.stem.2012.04.007.

Cdc42 activity regulates hematopoietic stem cell aging and rejuvenation

Affiliations

Cdc42 activity regulates hematopoietic stem cell aging and rejuvenation

Maria Carolina Florian et al. Cell Stem Cell. .

Abstract

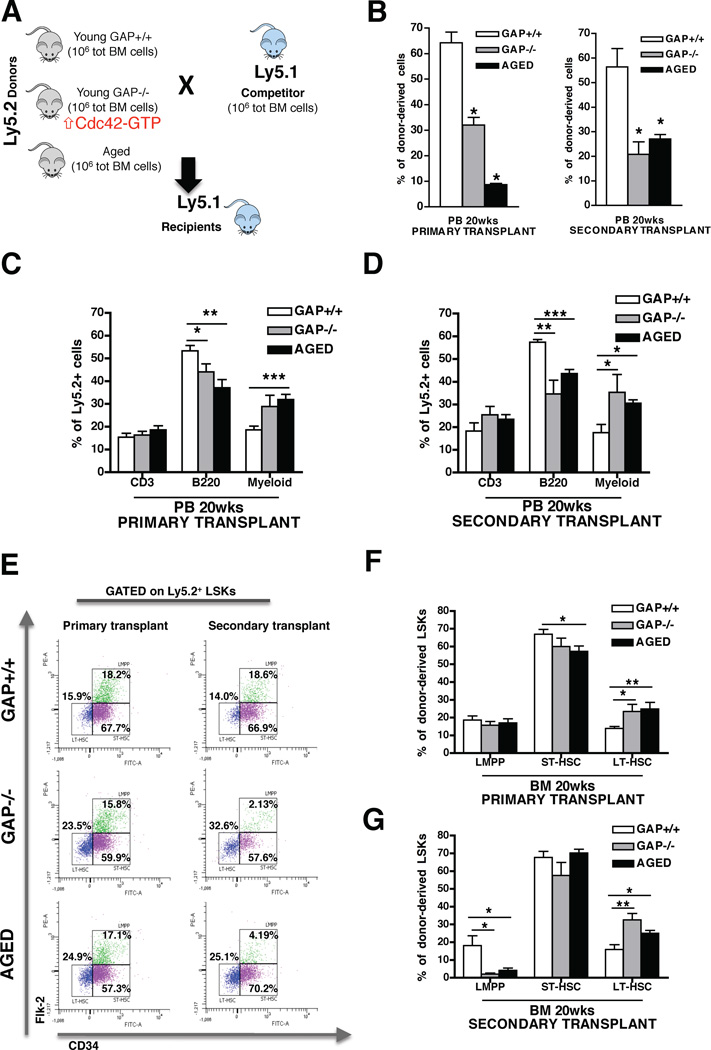
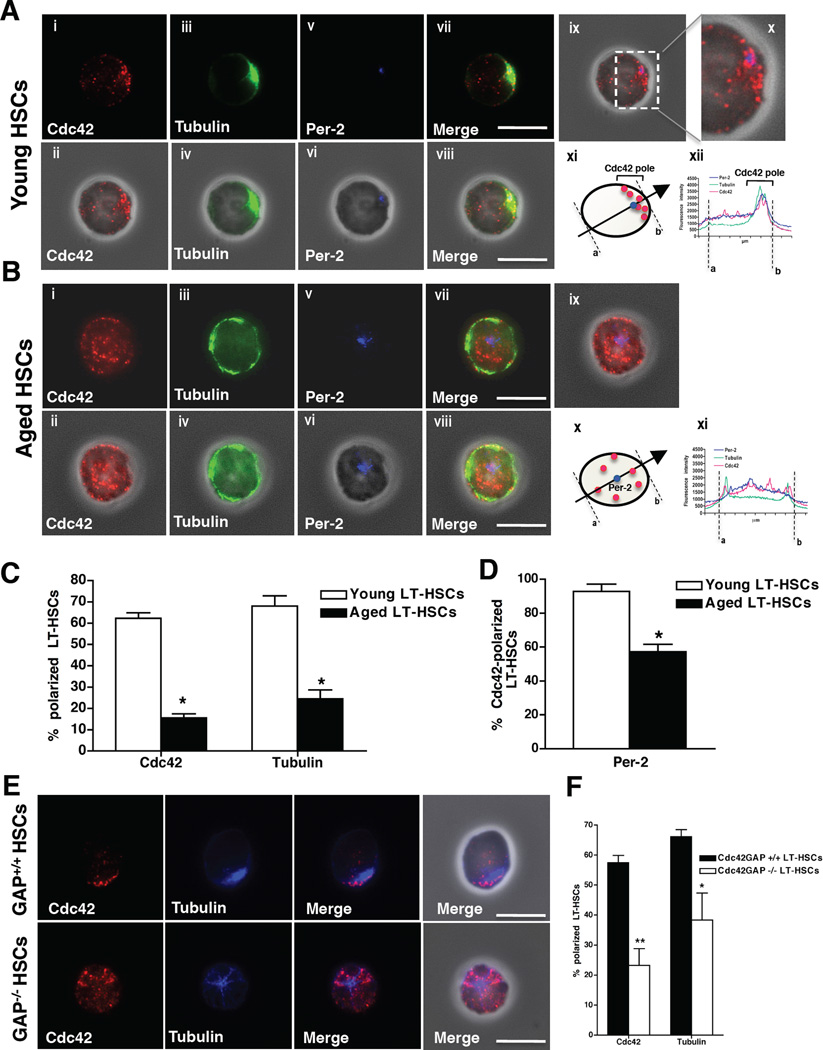
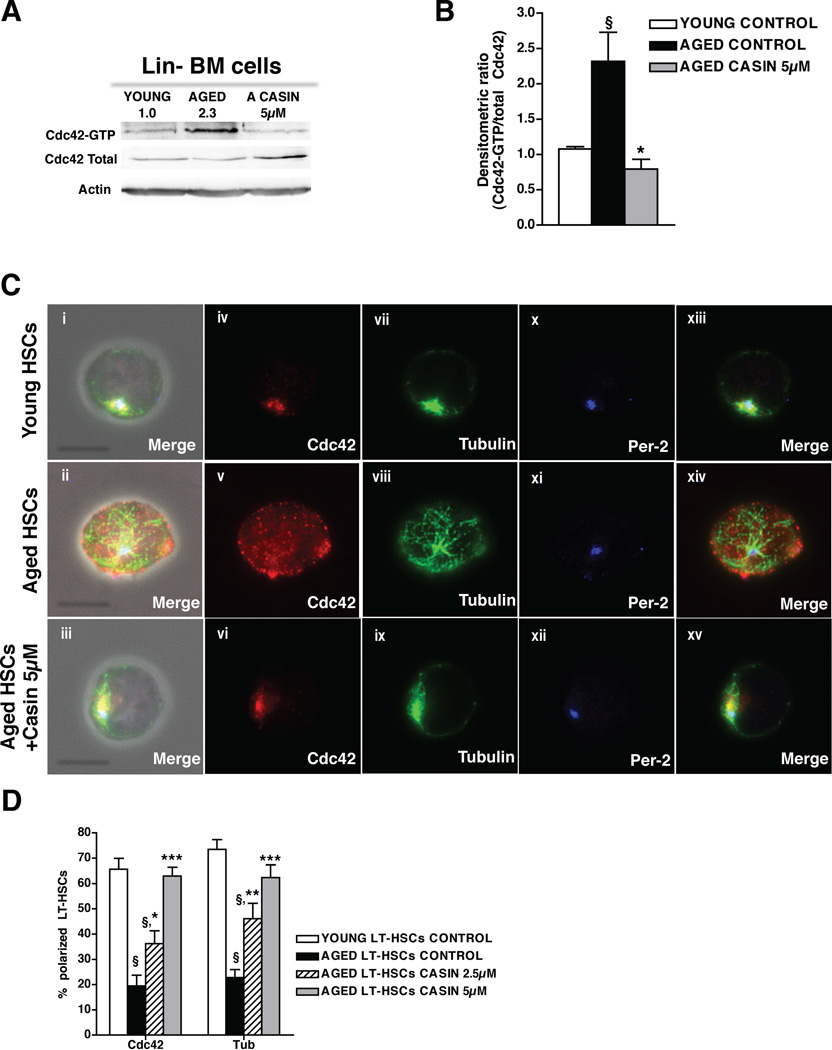
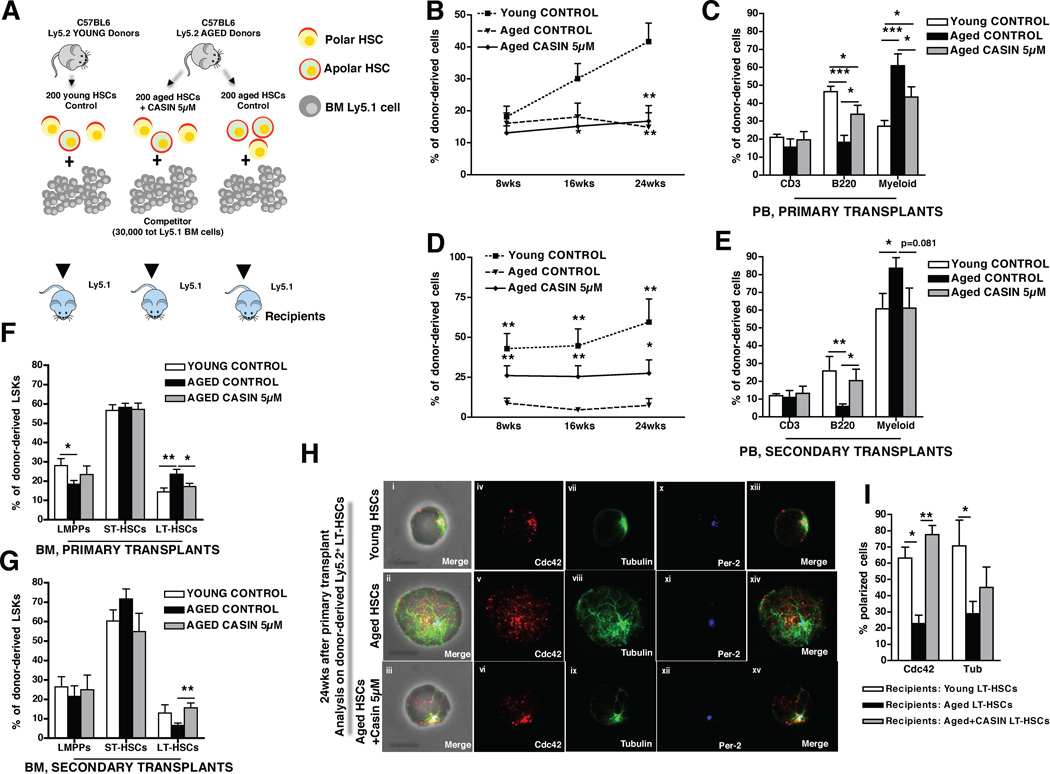
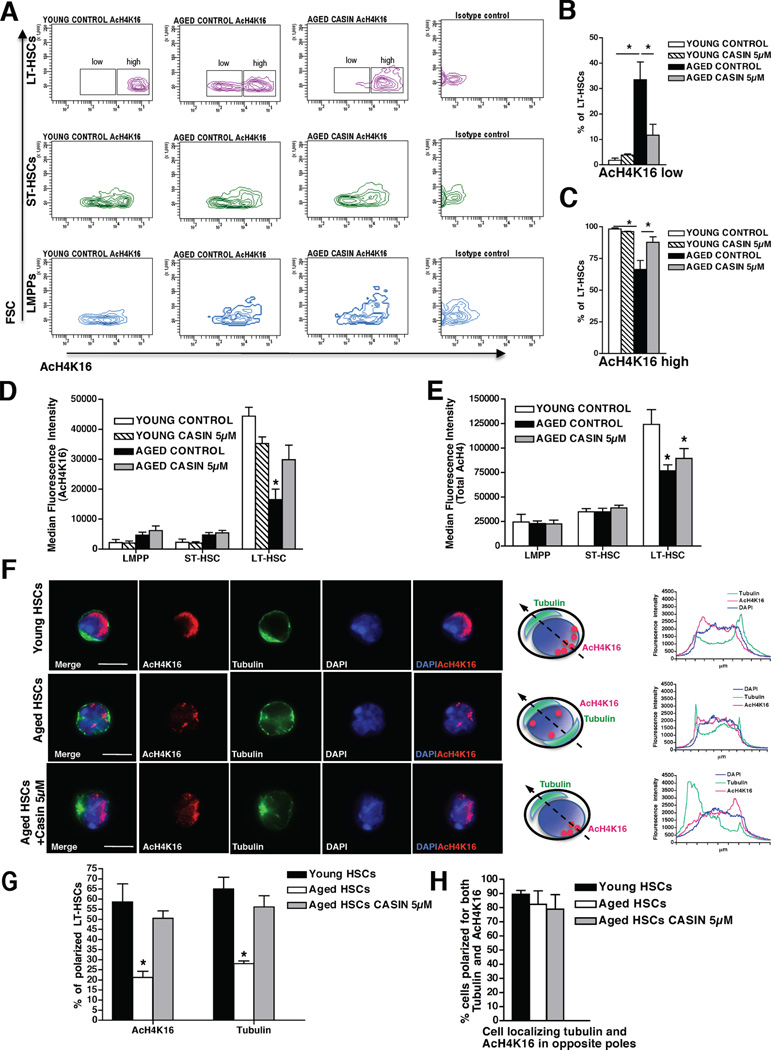
The decline in hematopoietic function seen during aging involves a progressive reduction in the immune response and an increased incidence of myeloid malignancy, and has been linked to aging of hematopoietic stem cells (HSCs). The molecular mechanisms underlying HSC aging remain unclear. Here we demonstrate that elevated activity of the small RhoGTPase Cdc42 in aged HSCs is causally linked to HSC aging and correlates with a loss of polarity in aged HSCs. Pharmacological inhibition of Cdc42 activity functionally rejuvenates aged HSCs, increases the percentage of polarized cells in an aged HSC population, and restores the level and spatial distribution of histone H4 lysine 16 acetylation to a status similar to that seen in young HSCs. Our data therefore suggest a mechanistic role for Cdc42 activity in HSC biology and epigenetic regulation, and identify Cdc42 activity as a pharmacological target for ameliorating stem cell aging.


Conflict of interest statement

CONFLICT OF INTEREST

The authors declare no competing financial interests.

Figures

Figure 1
Figure 1. Constitutively increased Cdc42 activity results in premature aging of young HSCs
(A), Scheme of the experimental set-up for the competitive BM transplants. (B), Contribution of total donor-derived Ly5.2+ cells in PB after 20 weeks in competitive primary and secondary transplants. Percentages of engrafted cells are normalized according to stem cell equivalent. Mice were considered as engrafted when the percentage of Ly5.2+ cells in PB was higher than 1.0 and contribution was detected for all PB lineages. (C–D), Contribution of B-cells, T-cells and myeloid cells among donor-derived Ly5.2+ cells in PB after 20 weeks in competitive primary (C) and secondary (D) transplants. (E–G), Representative FACS dot plots (E) and quantitative and statistical analysis of LT-HSCs, ST-HSCs and LMPPs distribution among donor-derived LSKs in primary (F) and secondary (G) transplanted mice. * P < 0.05, ** P < 0.01, *** P < 0.001; columns are mean +1 S.E. The experiment was repeated three times with a cohort of 4 to 5 recipient mice per group (n = 14). See also Figure S1.
Figure 2
Figure 2. Increased Cdc42 activity correlates with a de-polarized phenotype in LT-HSCs
(A), Representative distribution of Cdc42, tubulin and pericentrin-2 (Per-2) in young LT-HSCs determined by IF. Pictures are shown on a dark background (panels i, iii, v and vii) or as overlap with the phase contrast picture (panels ii, iv, vi and viii). Bar = 5µm. Panel ix and x show Cdc42 (red) and Per-2 (blue) distribution over the phase contrast picture. Panel xi: schematic presentation of a representative distribution of Cdc42 in young LT-HSCs (Per-2, blue dot; Cdc42, red dots). The arrow indicates the direction from “a” to “b” followed for determining fluorescence intensity in panel xii. Panel xii: representative fluorescence intensity plot obtained by collecting pixel intensity through the section of the cell as indicated in xi. (B), Representative distribution of Cdc42, tubulin and Per-2 in aged LT-HSCs determined by IF. Pictures are shown on a dark background (panels i, iii, v and vii) or as overlap with the phase contrast picture (panels ii, iv, vi and viii). Bar = 5µm. Panel ix shows Cdc42 (red) and Per-2 (blue) distribution over the phase contrast picture. Panel x: schematic presentation of a representative distribution of Cdc42 in aged LT-HSCs (Per-2, blue dot; Cdc42, red dots). The arrow indicates the direction from “a” to “b” followed for determining fluorescence intensity in panel xi. Panel xii: representative fluorescence intensity plot obtained by collecting pixel intensity through the section of the cell as indicated in x. (C), Percentage of young and aged LT-HSC cells with a polar distribution of Cdc42 and tubulin. Shown are mean +1 S.E., n=10; ~500–700 cells scored per sample in total. * p < 0.001. (D), Percentage of Per-2 polarized cells of Cdc42 polarized young and aged LT-HSCs. Cdc42-polarized cells were analyzed for Per-2 localization and scored positive when Per-2 was found at the Cdc42-pole. Shown are mean +1 S.E., n=4, ~150–250 cells scored per sample in total. * p < 0.05. (E), Representative distribution of Cdc42 and tubulin in young Cdc42GAP+/+ and Cdc42GAP−/− LT-HSCs. Pictures are shown on a dark background (panels i–vi) or as overlap with the phase contrast picture (panels vii and viii). Bar = 5µm. (F), Percentages of young Cdc42GAP+/+ (WT Control) and Cdc42GAP−/− LT-HSC cells with a polar distribution of Cdc42 and tubulin. Shown are mean mean +1 S.E., n=4, ~200–300 cells scored per sample in total. ** P < 0.01, *P < 0.05. See also Figure S2 and Movies S1–S3.
Figure 3
Figure 3. Pharmacological targeting of Cdc42 reverts aged apolar LT-HSCs to polar cells
(A), Representative Cdc42 activity in young, aged and CASIN (5 µM) treated aged lineage depleted bone marrow (LinBM) as determined by a pulldown/Western Blot assay. Active Cdc42 (Cdc42-GTP) was normalized with respect to total Cdc42 and actin as delineated by the numbers. (B), Ratio of the densitometric score of the Cdc42-GTP form and the total Cdc42 expression. Shown are mean +1 S.E., n=3, § p < 0.05 vs young control; *p < 0.05 vs. aged control. (C), Representative distribution of Cdc42, tubulin and Per-2 in young, aged and aged LT-HSCs treated with 5µM CASIN. Shown are overlaps with the phase contrast picture (panels i–iii) or cells on a dark background (panels iv–xv). Bar = 5µm. (D), Percentages of cells polarized for Cdc42 and tubulin in young, aged and aged LT-HSCs treated with 2.5 and 5µM CASIN. For each sample cells were singularly analyzed and scored for Cdc42 and tubulin polar distribution. Shown are mean mean +1 S.E., n=4, ~200–300 cells scored per sample in total. § p < 0.001 vs young control; *** p < 0.001 vs. aged control, ** p < 0.01 vs. aged control, * p < 0.05 vs. aged control. See also Figure S3.
Figure 4
Figure 4. Pharmacological targeting of Cdc42 activity rejuvenates LT-HSCs function
(A), Schematic representation of the experimental setup. 200 aged and young donor (Ly5.2+) LT-HSCs were cultured for 16hrs as indicated and subsequently transplanted into recipient (Ly5.1+) mice along with 3–105 BM competitor (Ly5.1+) cells. 24 wks post transplant recipient mice were sacrificed and secondary transplants were performed. (B and D), Percentage of donor contribution (Ly5.2+ cells) to total WBC in PB 8, 16 and 24 wks post transplant in primary (B) and secondary (D) transplants. Mice were considered as engrafted when the percentage of Ly5.2+ cells in PB was higher than 1.0 in primary transplants and than 0.5 in secondary transplants and contribution was detected for all PB lineages. Shown are mean values +1 S.E.; ** p < 0.01 and * p < 0.05 vs young control in B; *** p < 0.001, ** p < 0.01, * p < 0.05 vs aged control in D. (C and E), Percentage of B220+, CD3+ and myeloid cells among donor-derived Ly5.2+ cells in PB 24 weeks after primary (C) and secondary (E) transplants. * p < 0.05, ** p < 0.01, *** p < 0.001; shown are mean values +1 S.E. (F–G), Percentage of LT-HSCs, ST-HSCs and LMPPs cells in BM among donor-derived LSKs cells 24 weeks after primary (F) and secondary (G) transplants. ** p < 0.01; shown are mean values +1 S.E. Data is based on five (primary transplants) and four (secondary transplants) experimental repeats with 5 recipient mice per group (e.g. n=25 for primaries and n=20 for secondary transplants). (H), Representative distribution of Cdc42, tubulin and Per-2 in donor-derived LT-HSCs sorted from young, aged and aged CASIN treated LT-HSC recipient mice 24 weeks post transplant. Shown are overlaps with the phase contrast picture (panels i–iii) or cells on a dark background (panels iv–xv). Bar = 5µm. (I), Percentage of donor-derived LT-HSCs polarized for Cdc42 and tubulin sorted 24 weeks post transplant from recipient animals competitively reconstituted with young, aged and aged CASIN treated LT-HSC. Shown are mean values +1 SEM, n=3, ~50 cells scored per sample in total. ** p < 0.01, * p < 0.05. See also Figure S4.
Figure 5
Figure 5. Pharmacological targeting of Cdc42 activity restores the level and the spatial distribution of histone H4 lysine 16 acetylation
(A), Representative FACS density plots of AcH4K16 expression in LT-HSCs, ST-HSCs and LMPPs. Aged LT-HSCs distribute in two distinct subpopulations expressing low and high AcH4K16 levels. (B–C), Percentage of LT-HSCs expressing low (B) and high (C) levels of AcH4K16 according to the gating shown in (A). (D–E), Median fluorescence intensity detected for AcH4K16 (D) and total AcH4 (E) in LT-HSCs, ST-HSCs and LMPPs. Shown are mean values +1 SEM, n=3. * p < 0.05. (F), Representative distribution of AcH4K16 (red) and tubulin (green) in young, aged and aged LT-HSCs treated with 5µM CASIN. Nuclei are stained with DAPI (blue). Bar = 5µm. Schemes of Tubulin and AcH4K16 distributions in young, aged and aged LT-HSCs treated with 5µM CASIN and relative fluorescence intensity plot obtained by collecting pixel intensity through the section of the relative cell are also shown. (G), Percentages of cells polarized for AcH4K16 and tubulin in young, aged and aged CASIN treated (5µM) LT-HSCs. For each sample cells were singularly analyzed and scored for AcH4K16 and tubulin polar distribution. The percentage of polarized cells is plotted over the total number of cells scored. (H), Percentages of cells polarized for AcH4K16 and tubulin in opposite poles in young, aged and aged CASIN treated (5µM) LT-HSCs. The percentage of cells showing opposite polarity is plotted over the number of cells polarized for both markers. Shown are mean mean +1 S.E., n=3, ~100–150 cells scored per sample in total. * p < 0.01. See also Figure S5 and Movies S4–S5.

Comment in

References

    1. Adolfsson J, Mansson R, Buza-Vidas N, Hultquist A, Liuba K, Jensen CT, Bryder D, Yang L, Borge OJ, Thoren LA, et al. Identification of Flt3+ lympho-myeloid stem cells lacking erythro-megakaryocytic potential a revised road map for adult blood lineage commitment. Cell. 2005;121:295–306. - PubMed
    1. Alberts AS, Geneste O, Treisman R. Activation of SRF-regulated chromosomal templates by Rho-family GTPases requires a signal that also induces H4 hyperacetylation. Cell. 1998;92:475–487. - PubMed
    1. Barfod ET, Zheng Y, Kuang WJ, Hart MJ, Evans T, Cerione RA, Ashkenazi A. Cloning and expression of a human CDC42 GTPase-activating protein reveals a functional SH3-binding domain. J Biol Chem. 1993;268:26059–26062. - PubMed
    1. Beerman I, Bhattacharya D, Zandi S, Sigvardsson M, Weissman IL, Bryder D, Rossi DJ. Functionally distinct hematopoietic stem cells modulate hematopoietic lineage potential during aging by a mechanism of clonal expansion. Proc Natl Acad Sci U S A. 2010;107:5465–5470. - PMC - PubMed
    1. Beghe C, Wilson A, Ershler WB. Prevalence and outcomes of anemia in geriatrics: a systematic review of the literature. Am J Med. 2004;116(Suppl 7A):3S–10S. - PubMed

Publication types

MeSH terms