. 2012 May 4;10(5):583-94.
doi: 10.1016/j.stem.2012.02.020.

NuRD suppresses pluripotency gene expression to promote transcriptional heterogeneity and lineage commitment

Affiliations

NuRD suppresses pluripotency gene expression to promote transcriptional heterogeneity and lineage commitment

Nicola Reynolds et al. Cell Stem Cell. .

Abstract

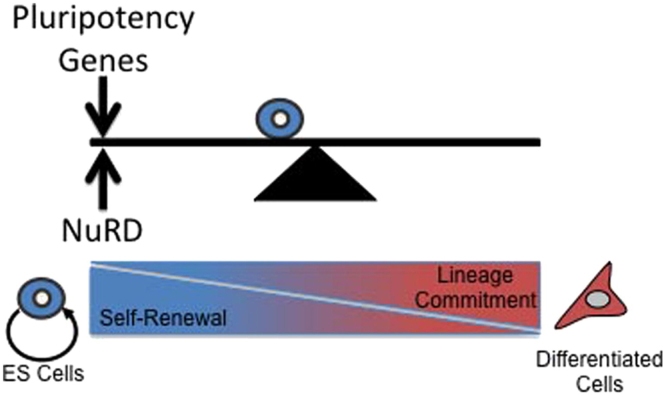
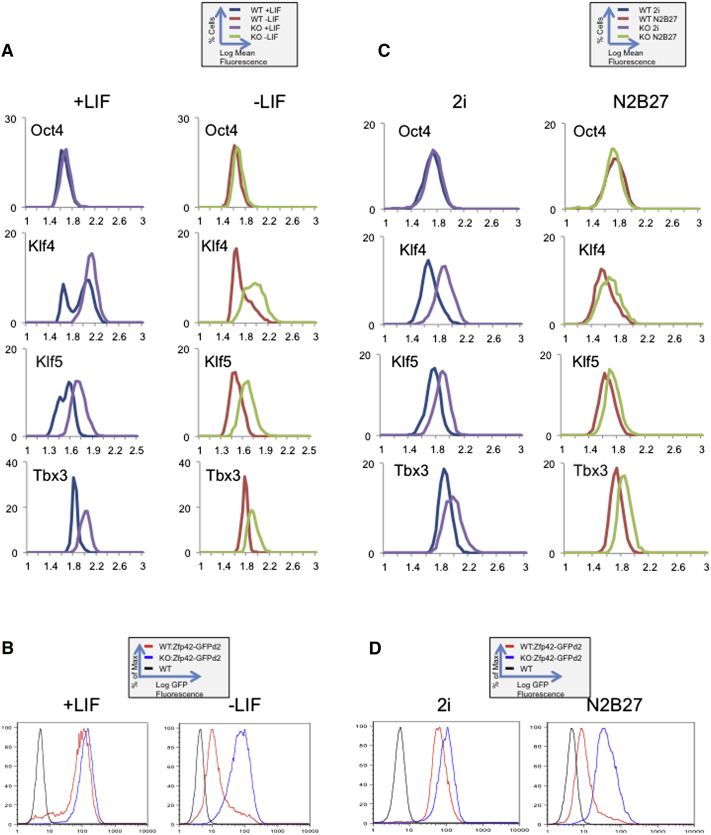
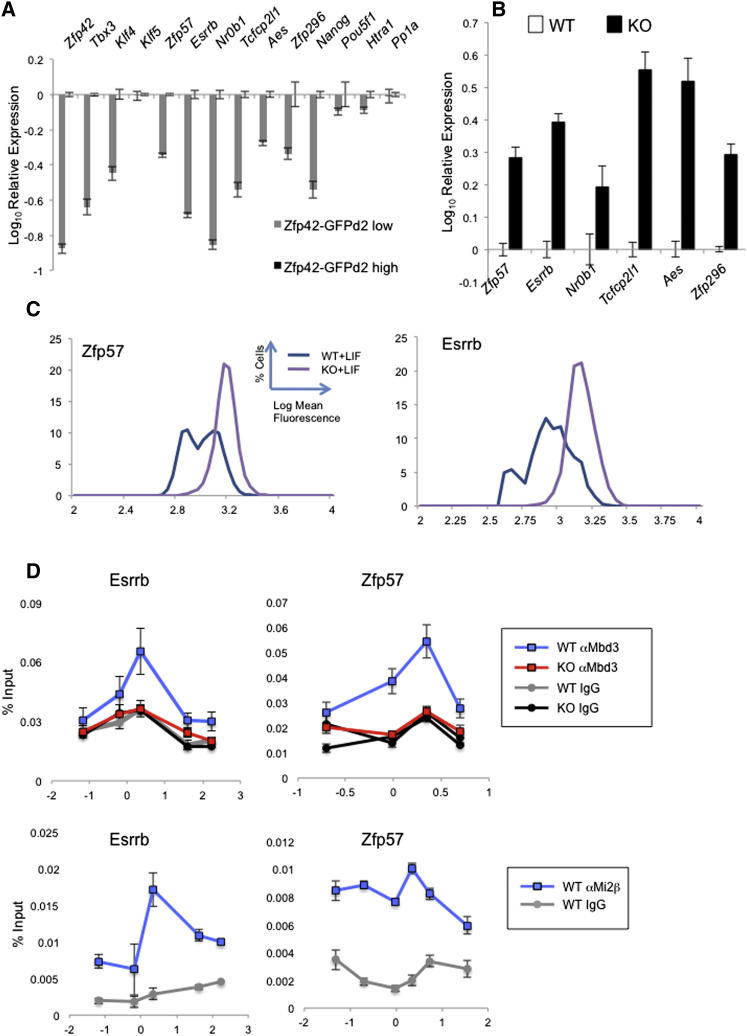
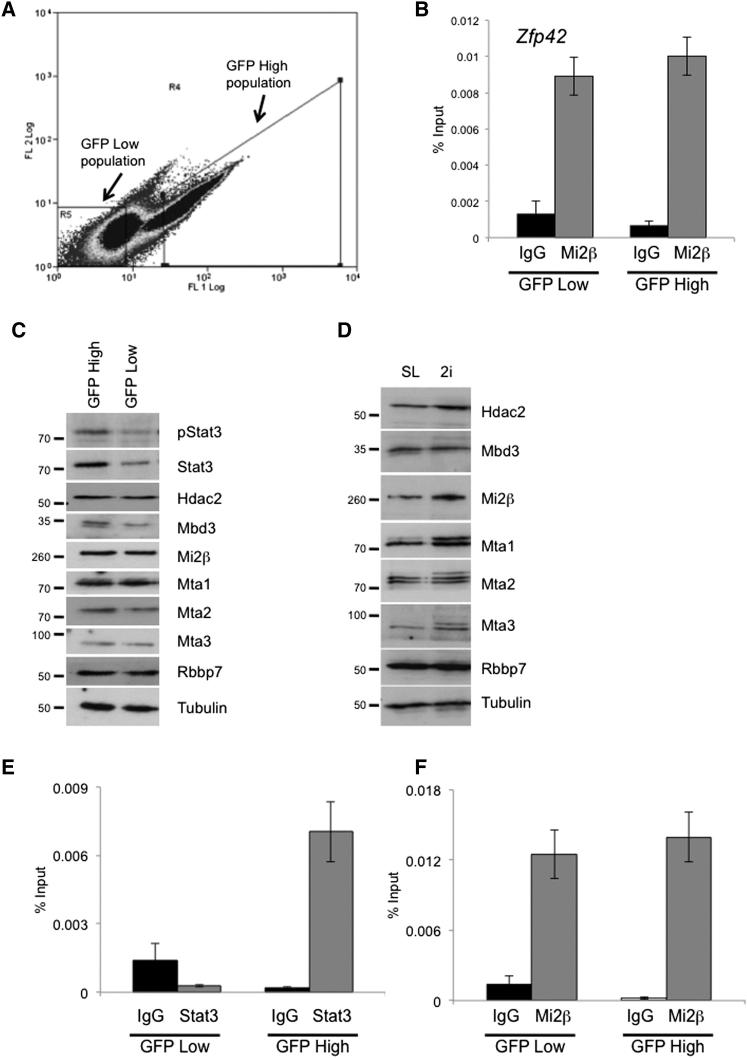
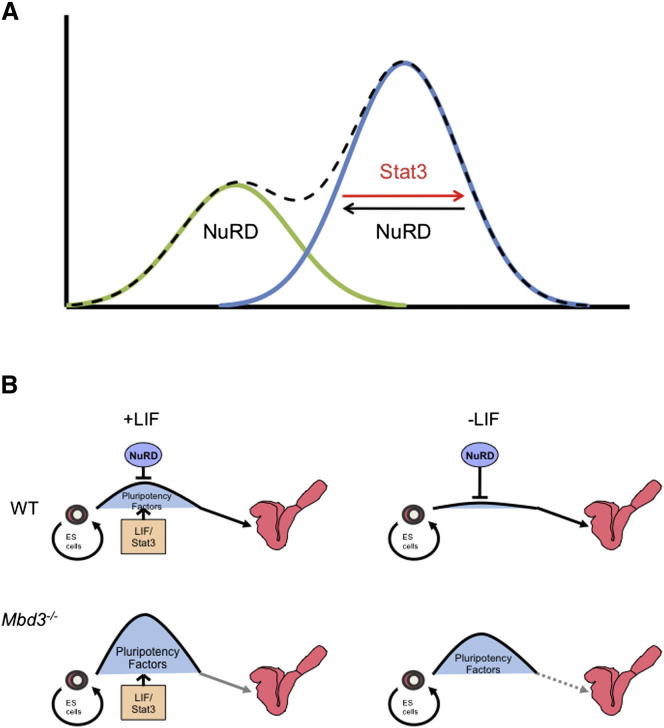
Transcriptional heterogeneity within embryonic stem cell (ESC) populations has been suggested as a mechanism by which a seemingly homogeneous cell population can initiate differentiation into an array of different cell types. Chromatin remodeling proteins have been shown to control transcriptional variability in yeast and to be important for mammalian ESC lineage commitment. Here we show that the Nucleosome Remodeling and Deacetylation (NuRD) complex, which is required for ESC lineage commitment, modulates both transcriptional heterogeneity and the dynamic range of a set of pluripotency genes in ESCs. In self-renewing conditions, the influence of NuRD at these genes is balanced by the opposing action of self-renewal factors. Upon loss of self-renewal factors, the action of NuRD is sufficient to silence transcription of these pluripotency genes, allowing cells to exit self-renewal. We propose that modulation of transcription levels by NuRD is key to maintaining the differentiation responsiveness of pluripotent cells.


Figures

None
Graphical abstract
Figure 1
Figure 1
NuRD Controls Expression Levels of Pluripotency Genes in ESCs (A) Expression of indicated genes in wild-type ESCs (WT), Mbd3−/− ESCs (KO), and Mbd3−/− ESCs rescued with an Mbd3b transgene (KO:Mbd3b), relative to the expression levels in wild-type ESCs grown in LIF and serum conditions. (B) Chromatin immunoprecipitation (ChIP) was performed using anti-Mi2β or a mouse IgG control antibody in wild-type ESCs grown in self-renewing conditions (+LIF) or after 24 hr of LIF withdrawal (−LIF). Immunoprecipitates were probed with primer pairs located across the indicated gene promoters and into the body of the genes and plotted as percentage of input (y axis). Numbers along the x axis indicate distance relative to transcription start site for indicated genes. “Ch19 GFR” refers to a gene-free region on chromosome 19 (Nóbrega et al., 2004). (C) ChIP using anti-Mbd3 or mouse IgG control antibody in wild-type (WT) or Mbd3−/− (KO) ESCs grown in standard serum and LIF conditions. See also Figure S1.
Figure 2
Figure 2
NuRD Restricts Expression Levels of Actively Transcribed Genes (A) Expression of indicated genes in Mbd3−/− ESCs grown in 2i/LIF relative to wild-type cells grown in the same conditions. (B) ChIP was performed using anti-Mi2β or a mouse IgG control antibody in wild-type ESCs grown in serum and LIF (SL) or in 2i/LIF conditions and probed with primers located at the transcription start sites for the indicated genes. (C) Expression of indicated genes in wild-type (WT) or Mbd3−/− ESCs expressing MER-Mbd3b-MER (M3bM) prior to tamoxifen treatment (0 hr) and after 20 or 38 hr of tamoxifen treatment, relative to the expression levels in wild-type ESCs. (D) MER-Mbd3b-MER goes to NuRD target genes after tamoxifen addition. ChIP was performed using anti-ER or a mouse IgG control antibody in Mbd3−/− ESCs expressing MER-Mbd3b-MER either in the absence of tamoxifen (0 hr) or after 20 hr of tamoxifen treatment (20 hr), which were then probed with primers located at the transcription start sites for the indicated genes. “GFR” refers to the chromosome 19 gene free region. p < 0.05, ∗∗p < 0.005. Error bars represent standard error of the mean (SEM).
Figure 3
Figure 3
Misexpression of NuRD Target Genes Contributes to the Differentiation Defect of Mbd3−/− ESCs (A) Expression of indicated genes in wild-type and Mbd3−/− ESCs in serum and LIF or in the absence of LIF for the indicated times is plotted relative to expression in wild-type cells prior to LIF withdrawal. Error bars represent SEM from ≥3 experiments performed on different wild-type and mutant ESC lines. See also Figure S2. (B) Expression levels of Klf4 (black bars) and Klf5 (white bars) in Mbd3 heterozygous ESCs (Flox/−) or Mbd3−/− ESC lines expressing microRNAs directed against Klf4, Klf5, and LacZ are displayed relative to expression levels seen in Mbd3Flox/− ESCs. Error bars represent SEM. (C) An alkaline phosphatase (AP) assay was performed using Mbd3Flox/− ESCs (referred to as WT for simplicity), Mbd3−/− ESCs (KO), and two different Mbd3−/− ESC lines each expressing microRNAs directed against Klf4 (K4-1 or K4-2) or Klf5 (K5-1 or K5-2), as well as one cell line expressing microRNAs against LacZ. The proportions of fully undifferentiated colonies staining uniformly for AP are represented in black (Undiff), partially differentiated colonies showing heterogeneous AP staining are in gray (Mixed), and fully differentiated colonies are in white (Diff). (D) Chimeric embryos made by aggregating indicated ESC lines with wild-type embryos dissected at 8.5 dpc. The presence of ESC-derived tissue is indicated by LacZ staining (blue). Areas where ES-derived cells have integrated with host embryos are indicated with arrows. Scale bars represent 1 mm. Images are representative of multiple examples of chimeric embryos. (E) Quantitation of chimera experiments. The percentage of chimeric embryos displaying little or no integration (No Integration; white columns) of ESCs with the host cells or significant integration (Some Integration; black columns) of ESCs with the host embryo are plotted for Mbd3−/− ESCs expressing a scrambled siRNA (“Control,” n = 25), siRNA directed against Klf4 (“Klf4 RNAi,” n = 24) or Klf5 (“Klf5 RNAi,” n = 28), Klf4 RNAi cells rescued by expression of an RNAi-resistant Klf4 cDNA (“K4R,” n = 9), and Klf5 RNAi cells rescued by expression of an RNA-resistant Klf5 cDNA (“K5R,” n = 24). Scoring for contribution was performed blind to the ESC genotype.
Figure 4
Figure 4
NuRD Controls Transcriptional Heterogeneity in ESCs (A) Expression levels for indicated proteins were measured in ESC cultures by antibody staining and immunofluorescence microscopy. Log of relative fluorescence is plotted along the x axis, with the proportion of cells indicated along the y axis. Data is shown for wild-type (WT) and Mbd3−/− (KO) ESCs grown in self-renewing conditions (+LIF, left-hand panels) or after 48 hr in the absence of LIF (−LIF, right-hand panels). n > 4,000 cells for each line. (B) Flow cytometry analysis showing expression profiles of Zfp42-GFPd2 in a wild-type (WT: ZFP42-GFPd2) or Mbd3−/− (KO: Zfp42-GFPd2) background grown in standard media with 10% serum either with or without LIF (+LIF or –LIF, respectively). (C) Expression levels for indicated proteins were measured as in (A) for wild-type (WT) and Mbd3−/− (KO) ESCs maintained in 2i/LIF (2i, left-hand panels) or in the absence of inhibitors and LIF for 24 hr (N2B27, right-hand panels). n > 1,800 cells for each line. (D) Flow cytometry analysis showing expression profiles of Zfp42-GFPd2 in a wild-type (WT: ZFP42-GFPd2) or Mbd3−/− (KO: Zfp42-GFPd2) background in 2i/LIF (2i) or in defined media without inhibitors and LIF (N2B27). See also Figure S3.
Figure 5
Figure 5
NuRD Is a General Regulator of Transcriptional Heterogeneity (A) Gene expression in Zfp42-GFPd2-low cells is expressed relative to expression in Zfp42-GFPd2-high cells (Marks et al., 2012). Included are genes identified by bioinformatic analysis (Zfp42, Tbx3, Klf4, Zfp57, Esrrb, Nr0b1, Tcfcp2l1, Aes, and Zfp296) as well as control pluripotency-associated genes (Klf5, Nanog, and Pou5f1) and one gene shown to be subject to NuRD-dependent transcriptional silencing in ESCs but not display transcriptional heterogeneity (Htra1; Reynolds et al., 2012). The latter two sets of genes do not display transcriptional heterogeneity in this assay. Ppia is a control housekeeping gene. (B) Expression of indicated genes in Mbd3−/− ESCs expressed relative to levels in wild-type ESCs. (C) Expression analysis for Zfp57 and Esrrb in wild-type (WT) and Mbd3−/− (KO) ESCs in serum and LIF conditions as in Figure 3A above. (D) ChIP was performed with anti-Mbd3 (top panels) and anti-Mi2β antibodies (bottom panels) as well as control IgG antibodies across the transcription start sites of Esrrb (left panels) and Zfp57 (right panels) in wild-type (WT) or Mbd3−/− (KO; anti-Mbd3 ChIP only) ESCs grown in serum and LIF conditions. Immunoprecipitates were probed with primer pairs located across the indicated gene promoters and plotted as percentage of input (y axis). Numbers along the x axis indicate distance relative to major ES transcription start site for indicated genes in ESCs. See also Table S1.
Figure 6
Figure 6
Variable Gene Expression Correlates with Variable Activator Activity (A) ESCs expressing GFPd2 from the Zfp42 locus (Zfp42-GFPd2) were separated according to GFP intensity (x axis) and side scatter (y axis). Gate R5 contains the GFP-low sorted fraction and gate R4 contains the GFP-high fraction used for ChIP. (B) ChIP was performed using anti-Mi2β or a mouse IgG control antibody in Zfp42-GFPd2-low and Zfp42-GFPd2-high cells as shown in (A). (C) Western blots showing relative levels of Stat3 and phospho-Stat3 (pStat3) or indicated NuRD components in sorted Zfp42-GFPd2-high (GFP High) and Zfp42-GFPd2-low (GFP Low) cells. Protein sizes are shown at left in kDa. α-Tubulin is shown as a loading control. (D) Western blots for indicated NuRD components in ESCs maintained in serum and LIF (SL) or 2i/LIF (2i) conditions. Protein sizes are shown at left in kDa. α-Tubulin is shown as a loading control. (E and F) ChIP for Stat3 (E) or Mi2β (F) at the Socs3 promoter as measured in Zfp42-GFPd2-low and -high populations.
Figure 7
Figure 7
Models of NuRD Function in ESCs (A) NuRD function at the cell population level. Schematized graph of the protein distribution for pluripotency proteins in a population of self-renewing ESCs is shown as a dashed black line. This distribution is likely to be made up of two distinct subpopulations, represented by the green and blue curves. Within the protein-high (blue) population, Stat3 stimulates transcription while NuRD restricts expression levels. Self-renewing cultures also contain cells (green) in which Stat3 signaling is not active and NuRD-mediated repression is unopposed, resulting in the formation of a distinct subpopulation of cells in which expression of the gene is low or off. (B) NuRD function at the level of individual ESCs. ESCs are maintained in a self-renewing state (left-hand side), which is energetically favorable in cells grown in serum and LIF (or 2i) conditions. To exit self-renewal and contribute toward the somatic lineages (right-hand side) involves overcoming a differentiation barrier, the height of which is maintained by LIF/Stat3, which in turn promotes the expression of pluripotency factors. In contrast NuRD acts to restrict the height of this barrier by delimiting the expression levels of pluripotency factors. In Mbd3−/− ESCs the limiting effect of NuRD is gone, so the pluripotency factors are overexpressed, resulting in an increased height of the differentiation barrier, and ESCs cannot differentiate even upon LIF withdrawal.

References

    1. Ahringer J. NuRD and SIN3 histone deacetylase complexes in development. Trends Genet. 2000;16:351–356. - PubMed
    1. Chambers I. The molecular basis of pluripotency in mouse embryonic stem cells. Cloning Stem Cells. 2004;6:386–391. - PubMed
    1. Chambers I., Colby D., Robertson M., Nichols J., Lee S., Tweedie S., Smith A. Functional expression cloning of Nanog, a pluripotency sustaining factor in embryonic stem cells. Cell. 2003;113:643–655. - PubMed
    1. Chambers I., Silva J., Colby D., Nichols J., Nijmeijer B., Robertson M., Vrana J., Jones K., Grotewold L., Smith A. Nanog safeguards pluripotency and mediates germline development. Nature. 2007;450:1230–1234. - PubMed
    1. Chen C., Sun X., Ran Q., Wilkinson K.D., Murphy T.J., Simons J.W., Dong J.-T. Ubiquitin-proteasome degradation of KLF5 transcription factor in cancer and untransformed epithelial cells. Oncogene. 2005;24:3319–3327. - PubMed

Publication types

MeSH terms

Substances

LinkOut - more resources