. 2012 May 4;10(5):620-34.
doi: 10.1016/j.stem.2012.02.013.

Recurrent variations in DNA methylation in human pluripotent stem cells and their differentiated derivatives

Affiliations

Recurrent variations in DNA methylation in human pluripotent stem cells and their differentiated derivatives

Kristopher L Nazor et al. Cell Stem Cell. .

Abstract

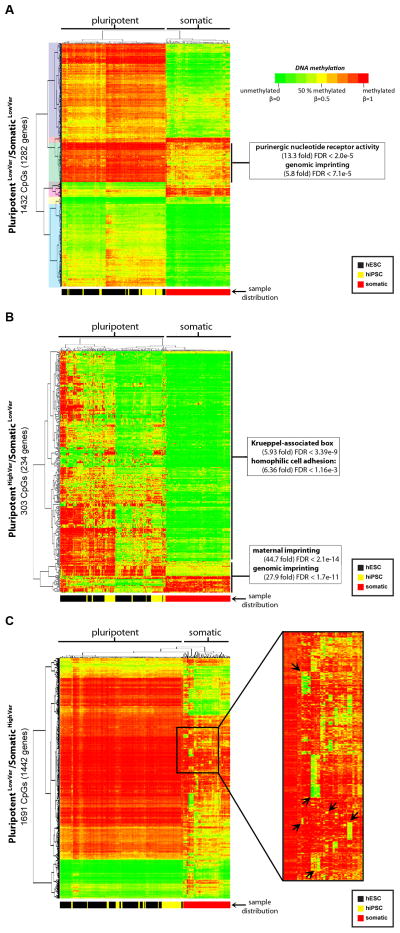
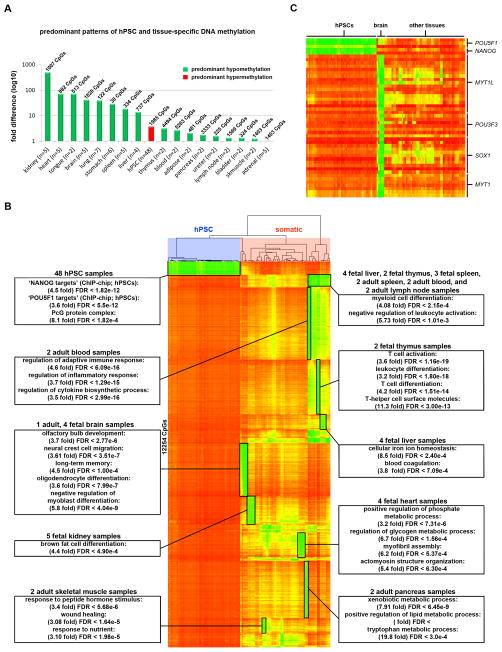
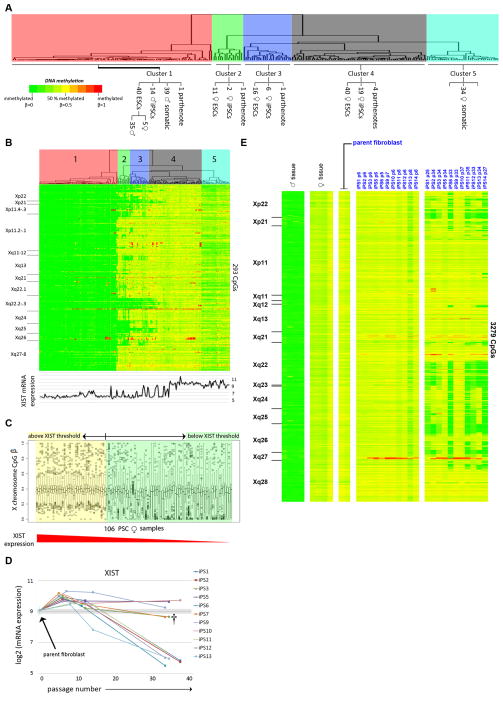
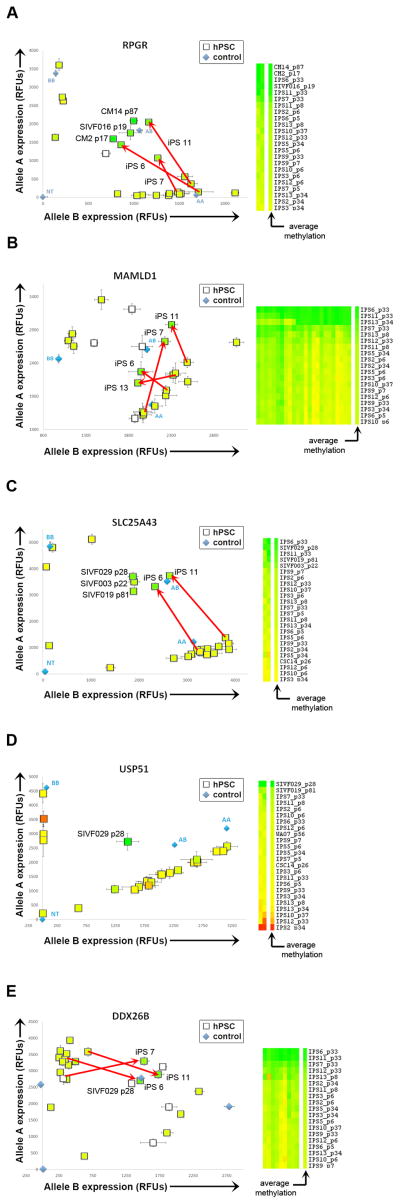
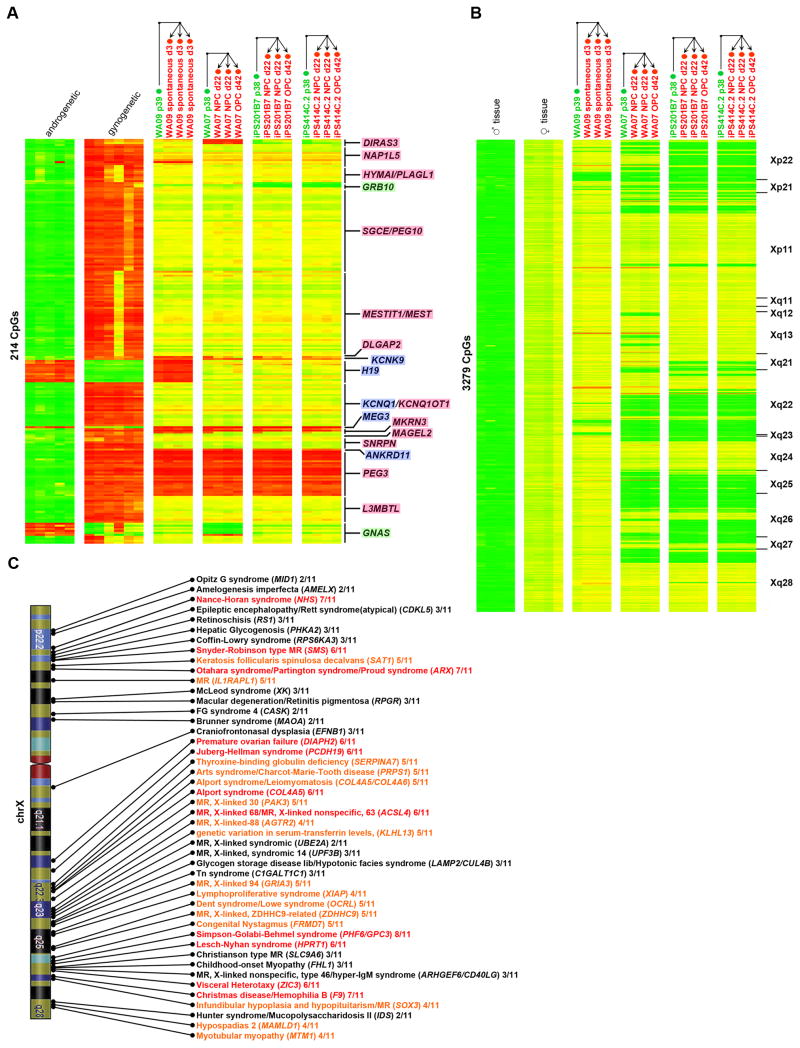
Human pluripotent stem cells (hPSCs) are potential sources of cells for modeling disease and development, drug discovery, and regenerative medicine. However, it is important to identify factors that may impact the utility of hPSCs for these applications. In an unbiased analysis of 205 hPSC and 130 somatic samples, we identified hPSC-specific epigenetic and transcriptional aberrations in genes subject to X chromosome inactivation (XCI) and genomic imprinting, which were not corrected during directed differentiation. We also found that specific tissue types were distinguished by unique patterns of DNA hypomethylation, which were recapitulated by DNA demethylation during in vitro directed differentiation. Our results suggest that verification of baseline epigenetic status is critical for hPSC-based disease models in which the observed phenotype depends on proper XCI or imprinting and that tissue-specific DNA methylation patterns can be accurately modeled during directed differentiation of hPSCs, even in the presence of variations in XCI or imprinting.


Figures

Figure 1
Figure 1. Differential DNA methylation in pluripotent and somatic cells
Data for CpG sites differentially methylated between pluripotent and somatic cells (Δβ > 0.2) on the 27K DNA Methylation array are shown. A. PluripotentLowVar/SomaticLowVar: 1432 CpGs for 1282 genes with low variation (s.d. < 0.2) within both the pluripotent and somatic sample groups. The seven clusters of CpGs that were examined using the GREAT algorithm are shaded on the left. B. PluripotentHighVar/SomaticLowVar: 303 CpGs for 234 genes with variable methylation only in the pluripotent group (s.d. > 0.2). C. PluripotentLowVar/SomaticHighVar: 1691 CpGs for 1442 genes with variable methylation only in the somatic group. The color scale for the β values is shown. The distribution of sample types are indicated below each heatmap, with hESCs in black, hiPSCs in yellow, and somatic cells in red. See also Figure S1 and Table S2.
Figure 2
Figure 2. Tissue-specific patterns of DNA methylation
Data for CpG sites on the 450K DNA Methylation array that were differentially methylated between samples from a given tissue and all other samples (Δβ > 0.5) are shown. A. The histogram shows the fold difference in total number of uniquely hypomethylated and hypermethylated CpGs for a given tissue (listed in Table S3). If hypomethylated CpGs predominate, the bar is green; if hypermethylated CpGs predominate, the bar is red. The total number of unique CpGs that were differentially methylated in the given tissue type is shown above each bar, and the total number of samples per tissue type is shown on the X-axis. B. 12,254 CpGs on the 450K DNA Methylation array with uniquely hypomethylated CpGs in specific tissue types. Functional enrichments for tissue-specific hypomethylated clusters are identified with boxes. Samples are grouped according to hierarchical clustering and CpGs are rank-ordered for each tissue (see also Table S3). C. DNA methylation of pluripotency- and neural-specific transcription factor genes.
Figure 3
Figure 3. Directed differentiation of hPSCs recapitulates epigenetic hallmarks of human tissues
A. Immunocytochemistry showing NESTIN and PAX6 staining in WA07-derived neural progenitor cells (NPCs) on day 22 of NPC differentiation. B. Immunostaining of A2B5 and OLIG1 in WA07-derived oligodendroctye precursor cells (OPCs) on day 42 of OPC differentiation. C. Immunostaining of GALC in WA07-derived oligodendrocytes on day 42 of OPC differentiation. Magnifications are indicated. D. DNA methylation (using the 450K DNA Methylation array) of select oligodendrocyte and neuronal genes in NPCs, OPCs, hPSCs and tissues. E. Diagram of DNA methylation patterns of PAX6 in NPCs, OPCs and brain samples corresponding to the chromosomal regions listed to the right of the heatmap in Figure 3D. Segments that are green are unmethylated and those that are red are methylated in the samples listed on the left. See also Figure S2 and Table S4.
Figure 4
Figure 4. DNA methylation of imprinted genes
Gene names highlighted in blue are paternally imprinted, pink are maternally imprinted and green are isoform dependent. Hierarachical clustering was performed for each group of samples (gynogenetic/androgenetic, hESCs, hiPSCs, somatic) independently. For each gene, CpG probes are ordered according to chromosomal position. A. DNA methylation (27K DNA Methylation array) of 49 imprinted CpG sites showing a gametic imprint pattern in parthenogenetic, androgenetic and tissue samples. B. DNA methylation (450K DNA Methylation array) of 214 gametic imprinted CpG sites in source fibroblasts and chondrocytes, early passage hiPSCs, and late passage hiPSCs. C–D. Allele-specific expression of PEG10 and PEG3 in hPSC and somatic samples. hPSC samples are represented as squares, somatic samples as triangles, and each data point is colored according to the average beta value for that gene shown in the heatmap to the right. Genomic DNA and no template (NT) controls are plotted as blue diamonds. Error bars indicate the standard error. See also Figure S3.
Figure 5
Figure 5. DNA methylation on the X chromosome
CpGs are ordered by chromosomal location, with the cytobands indicated to the left of the heatmaps. A–B. Hierarchical clustering of all samples according to 27K DNA Methylation array data. Cluster assignments are shown on the enlarged dendrogram above the heatmaps. XIST expression is shown below the heatmap. C. Box and whisker plot of chrX β values in 106 female hPSC samples ordered according to decreasing XIST expression. D. XIST expression in parental fibroblasts and 11 hiPSC clones at early, intermediate, and late passages shows an increase in XIST expression following reprogramming and a subsequent tendency for loss of XIST expression over time in culture. E. DNA methylation (450K DNA Methylation array) for fibroblast, early passage hiPSC, and late passage hiPSC samples. See also Figure S4–5.
Figure 6
Figure 6. Allele-specific expression of genes subject to XCI
Allele-specific expression of RPGR, MAMLD1, SLC25A43, USP51 and DDX26B in hPSC samples. hPSC samples are represented as squares and each data point is colored according to the average beta value for that gene shown in the heatmap to the right; data points without corresponding DNA methylation data are white. Red arrows identify HDF51 iPSC lines that switched from monoallelic expression at early passages to biallelic expression at late passages. Genomic DNA and no template (NT) controls are plotted as blue triangles. Error bars indicate the standard error.
Figure 7
Figure 7. Implications of aberrations in XCI and genomic imprints on disease modeling
A. DNA methylation (450K DNA Methylation array) of 214 gametic imprinted CpG sites at imprinted loci for control androgenetic and gynogenetic samples, undifferentiated (labeled with green text) and differentiated (labeled with red text) hPSC samples. Arrows indicate direction of differentiation. B. The heatmap shows DNA methylation (450K DNA Methylation array) on the X chromosome for control male tissue samples, control female tissue samples, undifferentiated samples (labeled with green text) and differentiated samples (labeled with red text) hPSC samples. Arrows indicate direction of differentiation. CpGs are ordered by chromosomal location, with the cytobands indicated to the left of the heatmap. C. Diagram indicating the frequency of loss of XCI at X-linked disease genes among 11 hiPSC clones reprogrammed from the same fibroblast culture. The number of clones showing loss of XCI at each locus is listed to the right of the gene name. Genes with loss of XCI in 1–3 clones are shown in black, in 4–5 clones in orange, and in 6–8 clones in red.

References

    1. Aberg K, Saetre P, Jareborg N, Jazin E. Human QKI, a potential regulator of mRNA expression of human oligodendrocyte-related genes involved in schizophrenia. Proc Natl Acad Sci U S A. 2006;103:7482–7487. - PMC - PubMed
    1. Adewumi O, Aflatoonian B, Ahrlund-Richter L, Amit M, Andrews PW, Beighton G, Bello PA, Benvenisty N, Berry LS, Bevan S, et al. Characterization of human embryonic stem cell lines by the International Stem Cell Initiative. Nat Biotechnol. 2007;25:803–816. - PubMed
    1. Allegrucci C, Wu YZ, Thurston A, Denning CN, Priddle H, Mummery CL, Ward-van Oostwaard D, Andrews PW, Stojkovic M, Smith N, et al. Restriction landmark genome scanning identifies culture-induced DNA methylation instability in the human embryonic stem cell epigenome. Hum Mol Genet. 2007;16:1253–1268. - PubMed
    1. Atanasoski S, Notterpek L, Lee HY, Castagner F, Young P, Ehrengruber MU, Meijer D, Sommer L, Stavnezer E, Colmenares C, et al. The protooncogene Ski controls Schwann cell proliferation and myelination. Neuron. 2004;43:499–511. - PubMed
    1. Bhusari S, Yang B, Kueck J, Huang W, Jarrard DF. Insulin-like growth factor-2 (IGF2) loss of imprinting marks a field defect within human prostates containing cancer. Prostate 2011 - PMC - PubMed

Publication types

Associated data