Meta-Analysis
. 2012 May 4;90(5):821-35.
doi: 10.1016/j.ajhg.2012.03.015.

A subset-based approach improves power and interpretation for the combined analysis of genetic association studies of heterogeneous traits

Collaborators, Affiliations
Meta-Analysis

A subset-based approach improves power and interpretation for the combined analysis of genetic association studies of heterogeneous traits

Samsiddhi Bhattacharjee et al. Am J Hum Genet. .

Abstract

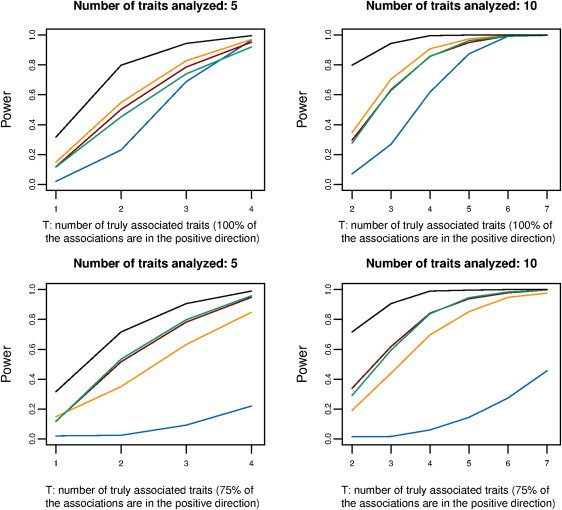
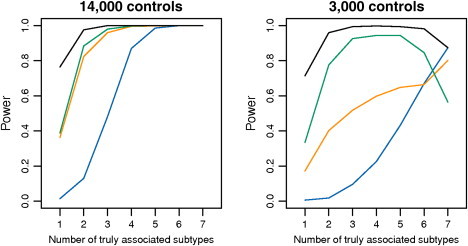
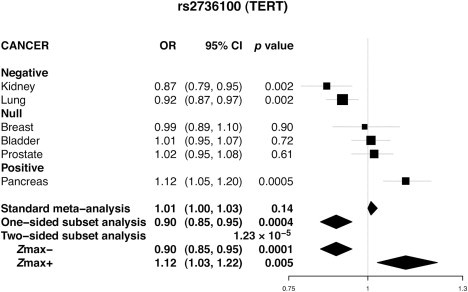
Pooling genome-wide association studies (GWASs) increases power but also poses methodological challenges because studies are often heterogeneous. For example, combining GWASs of related but distinct traits can provide promising directions for the discovery of loci with small but common pleiotropic effects. Classical approaches for meta-analysis or pooled analysis, however, might not be suitable for such analysis because individual variants are likely to be associated with only a subset of the traits or might demonstrate effects in different directions. We propose a method that exhaustively explores subsets of studies for the presence of true association signals that are in either the same direction or possibly opposite directions. An efficient approximation is used for rapid evaluation of p values. We present two illustrative applications, one for a meta-analysis of separate case-control studies of six distinct cancers and another for pooled analysis of a case-control study of glioma, a class of brain tumors that contains heterogeneous subtypes. Both the applications and additional simulation studies demonstrate that the proposed methods offer improved power and more interpretable results when compared to traditional methods for the analysis of heterogeneous traits. The proposed framework has applications beyond genetic association studies.


Figures

Figure 1
Figure 1
Simulation-Based Power comparison of Alternative Methods for Detecting an Overall Association In each simulation, it is assumed that a total of five or ten distinct traits are analyzed (for each trait, there are 2,000 cases and 2,000 controls). A variant with a MAF = 0.3 is assumed to be associated with a subset of the traits (the number of such traits is shown on the x axis) and has a fixed OR of 1.15 (see Figure S1 for results under heterogeneity of ORs). The upper panels assume that all of the associations are in the same (positive) direction, and the lower panels assume that 75% of the associations are positive and 25% are negative. In addition to the two-sided (green line) and one-sided (orange line) subset-based tests, power curves are also shown for the overall meta-analysis (blue line), Fisher's combined p value method (a multiple-degree-of-freedom [df] chi-square test) (maroon line), and a “gold-standard” test (black line) that assumes that the subset of non-null traits that are truly associated with the given SNP are known a priori. All powers are shown at an alpha level of 0.001.
Figure 2
Figure 2
Simulation-Based Power Comparison of Alternative Methods in the Analysis of a Case-Control Study with Heterogeneous Disease Subtypes Each simulation includes 14,000 cases equally distributed over seven subtypes. The left and right panels correspond to designs with 14,000 and 3,000 controls, respectively. A variant with a MAF of 0.3 is assumed to be associated with a subset of the subtypes (the number of such subtypes is shown on the x axis) and have a fixed OR of 1.15. The power curves for two alternative subset-based tests, “case-control” (orange line) and “case-complement” (green line), are shown along with those for an overall case-control analysis (blue line) and a “gold-standard” (black line) case-complement test that assumes that the subset of associated subtypes is known a priori. All powers are shown at an alpha level of 0.001.
Figure 3
Figure 3
Forest Plot showing the Effect of a TERT SNP across Cancers at Six Different Sites A two-sided subset-based test found (1) the cluster of kidney and lung cancers to be negatively associated, (2) pancreatic cancer to be positively associated, and (3) the cluster of breast, prostate, and bladder cancers to have no association. The p values for overall association with the use of standard meta-analysis, one-sided, and two-sided subset-based tests are shown along with their respective OR estimates at the bottom of the figure.

References

    1. Lango Allen H., Estrada K., Lettre G., Berndt S.I., Weedon M.N., Rivadeneira F., Willer C.J., Jackson A.U., Vedantam S., Raychaudhuri S. Hundreds of variants clustered in genomic loci and biological pathways affect human height. Nature. 2010;467:832–838. - PMC - PubMed
    1. Franke A., McGovern D.P., Barrett J.C., Wang K., Radford-Smith G.L., Ahmad T., Lees C.W., Balschun T., Lee J., Roberts R. Genome-wide meta-analysis increases to 71 the number of confirmed Crohn's disease susceptibility loci. Nat. Genet. 2010;42:1118–1125. - PMC - PubMed
    1. Cotsapas C., Voight B.F., Rossin E., Lage K., Neale B.M., Wallace C., Abecasis G.R., Barrett J.C., Behrens T., Cho J., FOCiS Network of Consortia Pervasive sharing of genetic effects in autoimmune disease. PLoS Genet. 2011;7:e1002254. - PMC - PubMed
    1. McGovern D.P., Gardet A., Törkvist L., Goyette P., Essers J., Taylor K.D., Neale B.M., Ong R.T., Lagacé C., Li C., NIDDK IBD Genetics Consortium Genome-wide association identifies multiple ulcerative colitis susceptibility loci. Nat. Genet. 2010;42:332–337. - PMC - PubMed
    1. Sivakumaran S., Agakov F., Theodoratou E., Prendergast J.G., Zgaga L., Manolio T., Rudan I., McKeigue P., Wilson J.F., Campbell H. Abundant pleiotropy in human complex diseases and traits. Am. J. Hum. Genet. 2011;89:607–618. - PMC - PubMed

Publication types