. 2012 Jul;33(21):5341-8.
doi: 10.1016/j.biomaterials.2012.04.024. Epub 2012 May 4.

Characterization of metabolic changes associated with the functional development of 3D engineered tissues by non-invasive, dynamic measurement of individual cell redox ratios

Affiliations

Characterization of metabolic changes associated with the functional development of 3D engineered tissues by non-invasive, dynamic measurement of individual cell redox ratios

Kyle P Quinn et al. Biomaterials. 2012 Jul.

Abstract

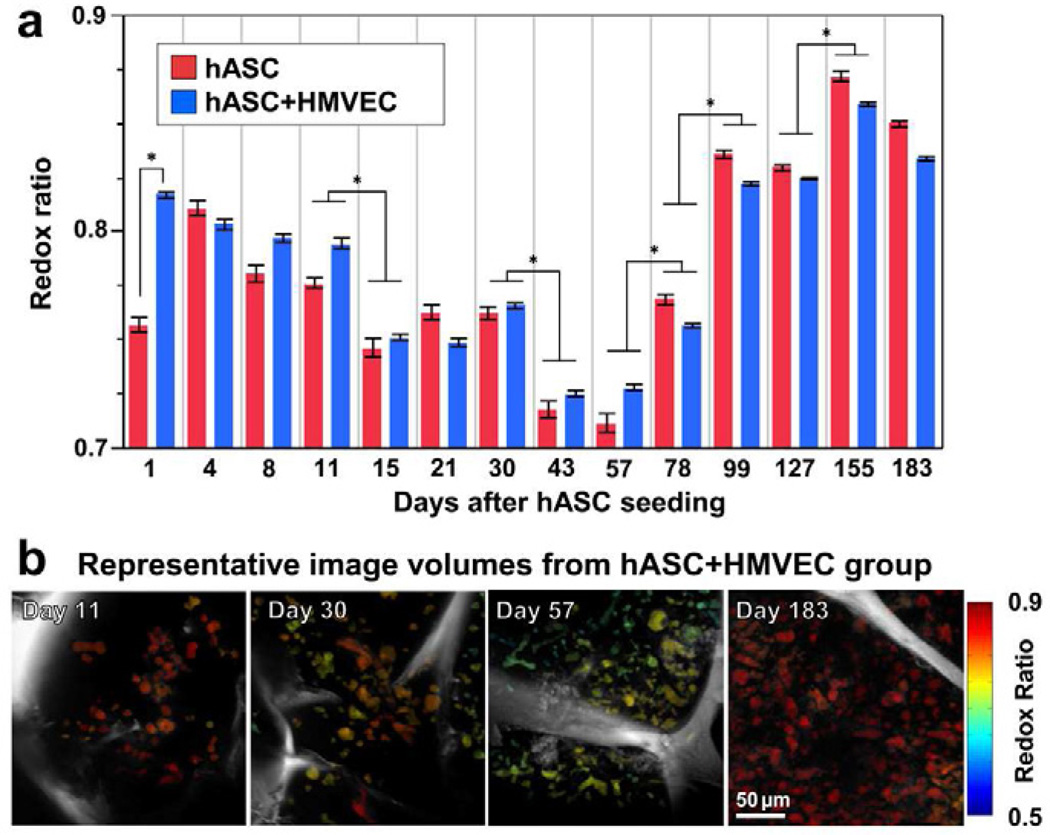
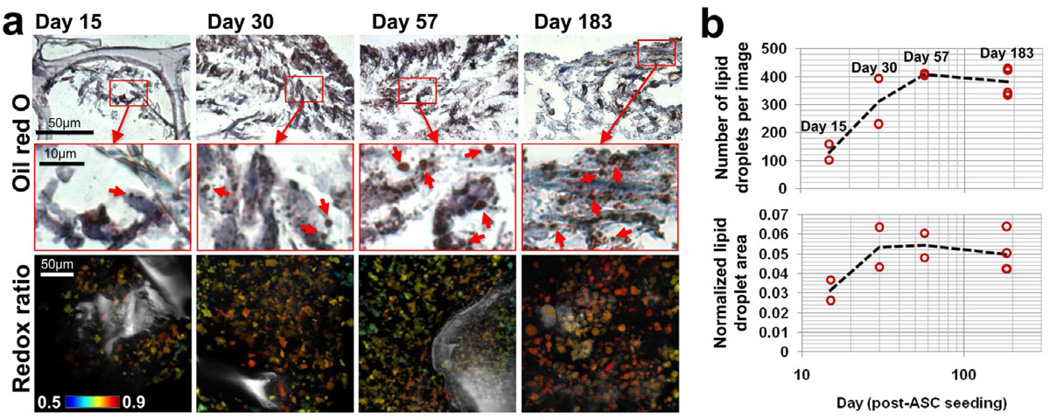
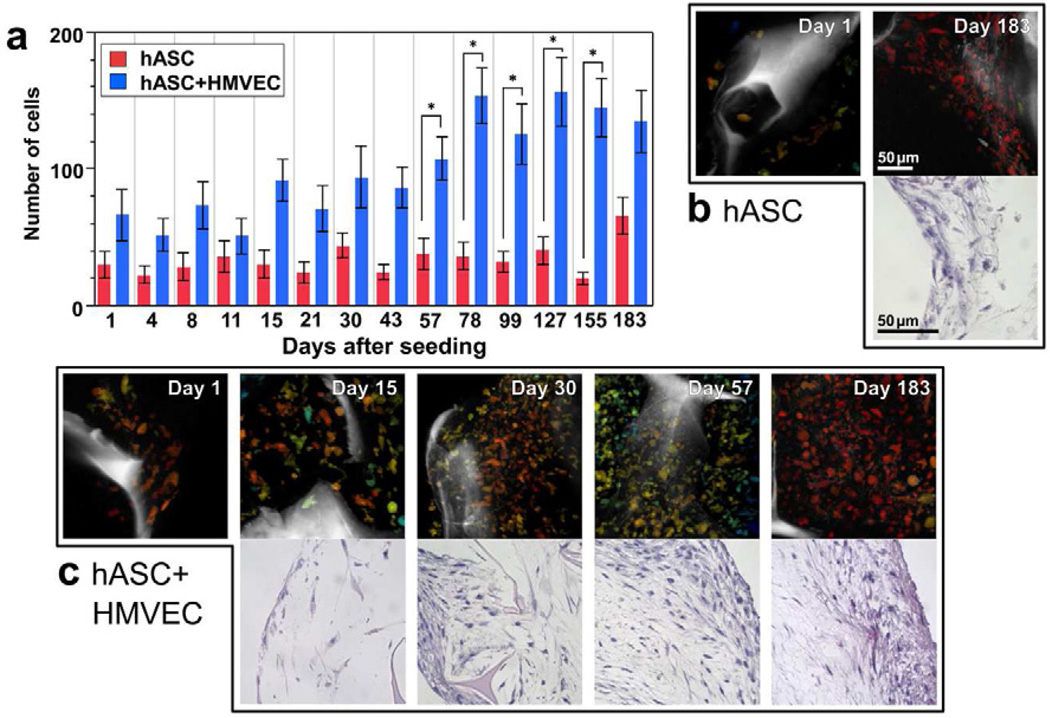
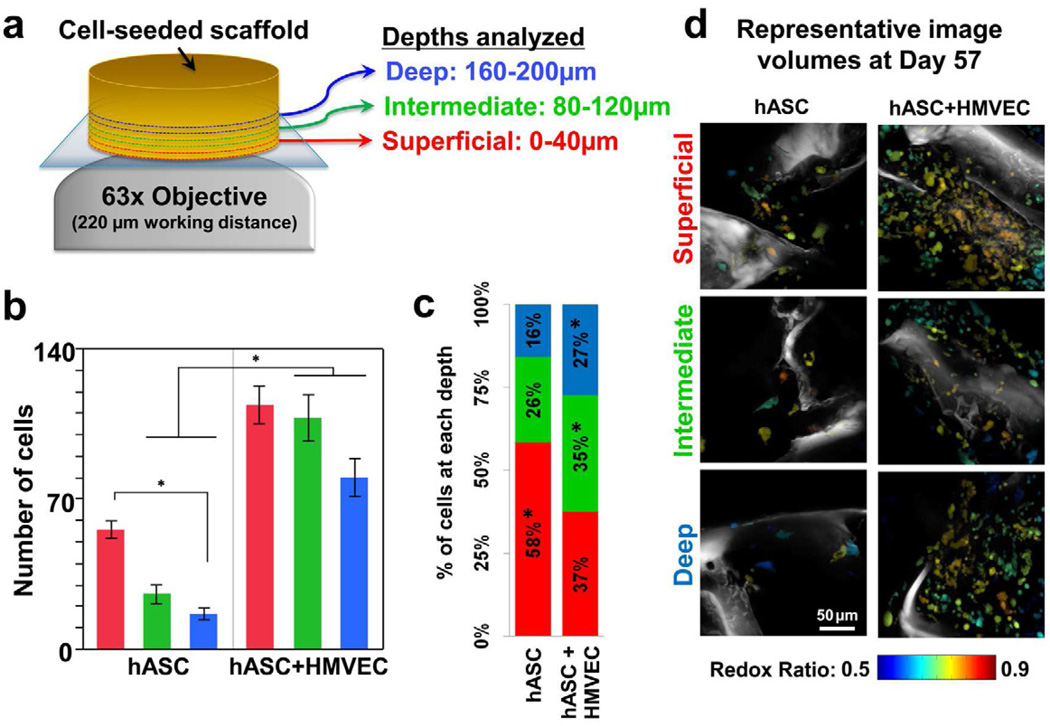
Non-invasive approaches to assess tissue function could improve significantly current methods to diagnose diseases and optimize engineered tissues. In this study, we describe a two-photon excited fluorescence microscopy approach that relies entirely on endogenous fluorophores to dynamically quantify functional metabolic readouts from individual cells within three-dimensional engineered tissues undergoing adipogenic differentiation over six months. Specifically, we employ an automated approach to analyze 3D image volumes and extract a redox ratio of metabolic cofactors. We identify a decrease in redox ratio over the first two months of culture that is associated with stem cell differentiation and lipogenesis. In addition, we demonstrate that the presence of endothelial cells facilitate greater cell numbers deeper within the engineered tissues. Since traditional assessments of engineered tissue structure and function are destructive and logistically intensive, this non-destructive, label-free approach offers a potentially powerful high-content characterization tool for optimizing tissue engineering protocols and assessing engineered tissue implants.


Figures

Figure 1
Figure 1. Transient decrease in redox ratio was detected during adipose tissue development over 6 months
a) In both hASC and hASC/HMVEC co-culture groups, significant decreases in redox ratio were detected at Days 15 and 43 (* p≤0.05), while significant increases in redox ratio were detected at Days 78, 99, and 155 (* p≤0.0018). Significant differences between groups were only detected at Day 1 (p=0.0386). Error bars represent standard error. b) Cell-specific redox ratios were color-coded in image volume projections in the axial direction and demonstrate the dynamic changes in redox state over time. The silk scaffold is visible within each image volume in gray-scale.
Figure 2
Figure 2. Lipid droplet accumulation measured by oil red O stain coincides with a decrease in redox ratio
a) Small lipid droplets (1–3µm) were evident from oil red O staining within cells at all histological time points. An increase in droplet numbers between Day 15 and 57 coincided with a decrease in redox ratio between those time points. b) The average number of lipid droplets was quantified in each image and suggests lipid droplets began forming around Day 10 but did not increase in number after the redox ratio reached a minimum at Day 57. The total lipid droplet area was normalized by cell area in each image and also demonstrates an increase in lipid accumulation over the first 57 days, with no significant difference between Day 57 and Day 183.
Figure 3
Figure 3. Differences in cell proliferation were detected among the groups through automated cell segmentation of TPEF images and correspond to differences in H&E histology
a) The average number of cells in the image volumes of the co-culture (hASC+HMVEC) group significantly increased with significant differences detected at Days 57 through 155 relative to the hASC mono-culture group (* p≤0.0162). Error bars represent standard error. b) The number of cells detected in TPEF image volume projections coincided with trends in the H&E stained sections. Fewer cells were visible in both TPEF volumes and H&E sections within the hASC mono-culture group at Day 183 compared to the co-culture group. c) An increase in cell numbers over time is evident in the co-culture group through both TPEF image volumes and H&E stained sections. The TPEF and H&E image scale bars in (b) apply to the respective images in (c) as well.
Figure 4
Figure 4. Cell segmentation of TPEF images reveals depth-dependent differences between groups
a) TPEF image volumes were acquired at three different depths within the tissue. b) Significantly more cells were identified from TPEF volumes at the intermediate and deepest depths in hASC+HMVEC co-culture scaffolds compared to hASC mono-culture scaffolds (* p≤0.0281). Fewer cells were identified in the deepest region (160–200µm) of the mono-culture tissue compared to the surface (0–40µm) (* p=0.0454). Error bars represent standard error. c) A significantly greater proportion of the total cells resided in the intermediate and deep zones within the co-culture scaffolds compared to the mono-culture scaffolds (* p≤0.0149). d) Despite maintaining larger cell populations deeper within the tissue, no depth-dependent differences in redox ratio were detected in the co-culture scaffolds as demonstrated by the representative image volume projections.
Figure 5
Figure 5. HMVECs may facilitate cell proliferation deeper within co-culture tissues
a) CD-31 stained sections demonstrate the aggregation of HMVECs within the tissue, which may promote ASC growth deeper within the tissue. b) The formation of rudimentary lumens by the HMVECs (indicated by arrow) may also aid in oxygen and nutrient transport deeper within the tissue.
Figure 6
Figure 6. Schematic of the fatty acid synthesis and oxidative phosphorylation pathways with an emphasis on the roles of NADH and FAD
An increase in the demand for fatty acid synthesis relative to oxidative phosphorylation may produce an accumulation of mitochondrially-bound NADH and a decrease in NAD+. A lack of available NAD+ in the mitochondria would produce a lower ratio of FAD/FADH2 from enzyme complexes containing lipoamide dehydrogenase (LipDH), such as pyruvate dehydrogenase (PDH). ETC= electron transport chain; PC= pyruvate carboxylase; MDH = malate dehydrogenase; TCA= tricarboxylic acid.

References

    1. Coleman SR. Structural fat grafting: more than a permanent filler. Plast Reconstr Surg. 2006;118:108S–120S. - PubMed
    1. Soto-Gutierrez A, Yagi H, Uygun BE, Navarro-Alvarez N, Uygun K, Kobayashi N, et al. Cell delivery: from cell transplantation to organ engineering. Cell Transplant. 2010;19:655–665. - PMC - PubMed
    1. Dvir T, Timko BP, Kohane DS, Langer R. Nanotechnological strategies for engineering complex tissues. Nat Nanotechnol. 2011;6:13–22. - PMC - PubMed
    1. Li WJ, Tuli R, Okafor C, Derfoul A, Danielson KG, Hall DJ, et al. A three-dimensional nanofibrous scaffold for cartilage tissue engineering using human mesenchymal stem cells. Biomaterials. 2005;26:599–609. - PubMed
    1. Kim HJ, Kim UJ, Vunjak-Novakovic G, Min BH, Kaplan DL. Influence of macroporous protein scaffolds on bone tissue engineering from bone marrow stem cells. Biomaterials. 2005;26:4442–4452. - PubMed

Publication types

MeSH terms