. 2012 May 6;14(6):614-24.
doi: 10.1038/ncb2495.

Cnn1 inhibits the interactions between the KMN complexes of the yeast kinetochore

Affiliations

Cnn1 inhibits the interactions between the KMN complexes of the yeast kinetochore

Lucy J Bock et al. Nat Cell Biol. .

Erratum in

  • Nat Cell Biol. 2013 Mar;15(3):335

Abstract

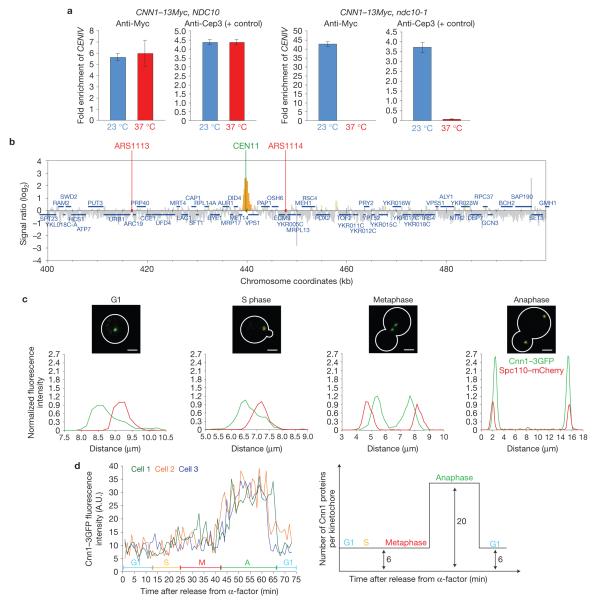
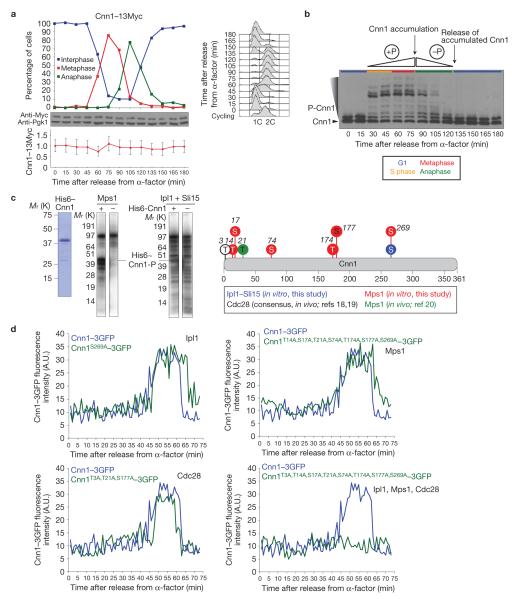
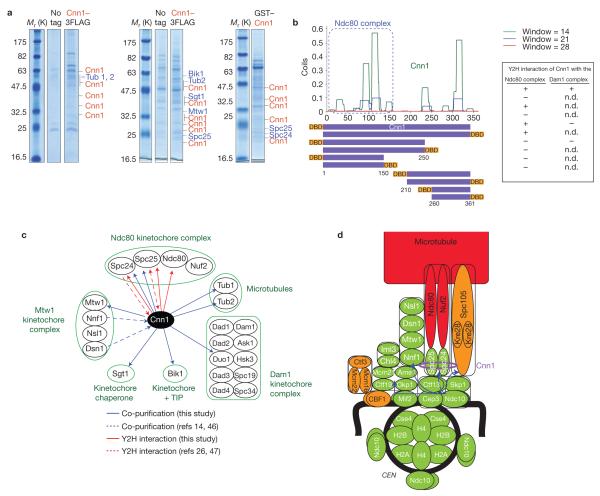
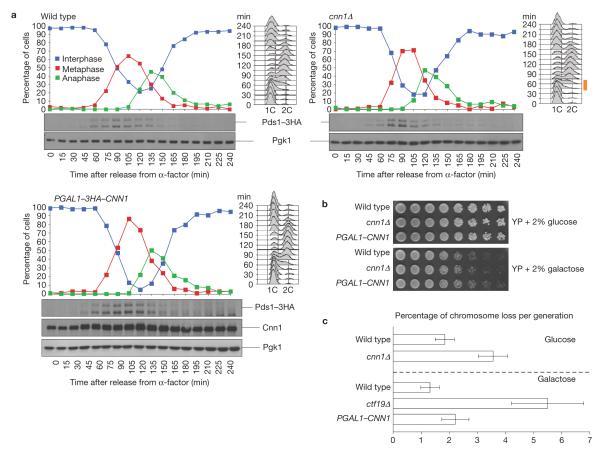
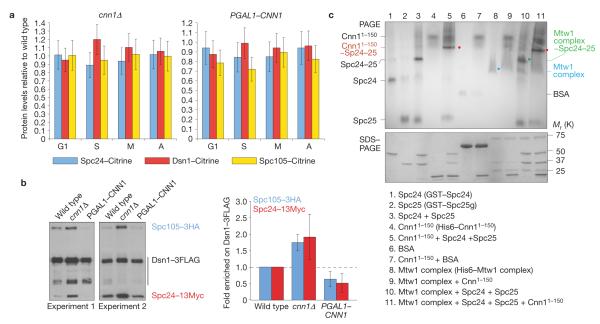
Kinetochores attach the replicated chromosomes to the mitotic spindle and orchestrate their transmission to the daughter cells. Kinetochore-spindle binding and chromosome segregation are mediated by the multi-copy KNL1(Spc105), MIS12(Mtw1) and NDC80(Ndc80) complexes that form the so-called KMN network. KMN-spindle attachment is regulated by the Aurora B(Ipl1) and MPS1(Mps1) kinases. It is unclear whether other mechanisms exist that support KMN activity during the cell cycle. Using budding yeast, we show that kinetochore protein Cnn1 localizes to the base of the Ndc80 complex and promotes a functionally competent configuration of the KMN network. Cnn1 regulates KMN activity in a spatiotemporal manner by inhibiting the interaction between its complexes. Cnn1 activity peaks in anaphase and is driven by the Cdc28, Mps1 and Ipl1 kinases.


Figures

Figure 1
Figure 1
Cnn1 is a kinetochore component whose concentration at kinetochores peaks in anaphase. (a) Cnn1–13Myc chromatin immunoprecipitates with centromeres (CEN) in a kinetochore-dependent fashion. A CNN1–13Myc NDC10 strain and the isogenic CNN1–13Myc ndc10-1 mutant were grown at 23 °C (permissive temperature, blue bars), and in parallel at 23 °C followed by a 3 h shift to 37 °C (restrictive temperature, red bars). The temperature shift inactivates Ndc10-1, which prevents kinetochore assembly following CEN replication. The bars show the amount of CENIV that was enriched in three independent ChIP experiments (n = 3) as measured relative to the input (untreated cell extract). The error bars represent s.d. In parallel, an anti-Cep3 ChIP was performed on the yeast cell extracts and served as the positive control, as Cep3 depends on Ndc10 for CEN association. A ChIP performed without antibody acted as the specificity control (no enrichment of CENIV, data not shown). (b) Cnn1 localizes to centromeres, as shown by ChIP–chip analysis. Endogenous Cnn1 was C-terminally tagged with a Pk6 epitope and submitted to ChIP. Chromatin co-immunoprecipitated with Cnn1–Pk6 was isolated, PCR-amplified with random primers and labelled with biotin. The biotinylated DNA was then hybridized to the Saccharomyces cerevisiae genome (Tiling Array 1.0R, Affymetrix). The supernatant of the immunoprecipitate was used as the hybridization control. Data analysis was performed with GeneChip Command Console Software (Affymetrix). Cnn1–Pk6 binding (yellow) around CENXI is shown. (c) Cnn1 is a kinetochore protein. Representative cells of a Cnn1–3GFP Spc110–mCherry strain were imaged by spinning-disc confocal microscopy (top panels). The fluorescence signals were measured, normalized and plotted along the cell axis (μm; bottom panels). Scale bars,4 μm. (d) Cnn1 localizes to kinetochores in a cell-cycle-stage-dependent manner. Cnn1–3GFP Spc110–mCherry cells were synchronized in late G1 (5 μg ml−1 -factor), released into the cell cycle (2% glucose YP medium), and imaged by time-lapse wide-field Deltavision deconvolution fluorescence microscopy. Cnn1–3GFP localization during the cell cycle of three cells is plotted in the left panel (Spc110–mCherry was the internal reference) and is graphically summarized in the right panel. G1, S phase, metaphase (M) and anaphase (A) are indicated.
Figure 2
Figure 2
The enrichment of Cnn1 at anaphase kinetochores is phospho-driven. (a) Cnn1 levels remain constant through the cell cycle. Cnn1–13Myc cells were synchronized in G1, released into the cell cycle (2% glucose YP medium) and tracked over time (DNA content, FACS; spindle morphology, anti-Tub1 immunofluorescence analysis). After 90 min, 2.5 μg ml−1 -factor was added to prevent the cells from entering a new cell cycle. The cell-cycle stages are shown in the upper plot. Cnn1–13Myc was visualized (anti-Myc western hybridization, Pgk1 was the loading control (middle blots)) and its levels during the cell cycle were quantified (relative to those of Pgk1 (lower plot)). The error bars represent the standard deviations of the measurements from three blot exposures. (b) Cnn1 is a phospho-protein. The phosphorylation state of Cnn1–13Myc was examined by PhosTag SDS–PAGE and anti-Myc western hybridization. Cell cycle stages are indicated. (c) Cnn1 is a substrate of the Mps1 and Ipl1 kinases. Recombinant His6–Cnn1 (left image) was phosphorylated by recombinant Mps1 (middle image) or by recombinant Ipl1 plus Sli15 (right image) in the presence of radiolabelled ATP. Mass spectrometric phospho-mapping of His6–Cnn1 phosphorylated by either kinase in the presence of cold ATP identified six Mps1 target residues and one Ipl1 target residue (Supplementary Fig. S2). Thr 3, Thr 21 and Ser 177 correspond to the Cdc28 recognition consensus (www.phosida.com; refs 18,19). Thr 21 was suggested to be phosphorylated by Mps1 in vivo (graphically summarized on the right). (d) The accumulation of Cnn1–3GFP at anaphase kinetochores is driven by Cdc28, Mps1 and Ipl1 kinase activities. Strains endogenously expressing wild-type Cnn1–3GFP (blue) or Cnn1–3GFP containing phospho-mimetic null mutations in residues targeted by each kinase or by all three kinases combined (green) were imaged during a synchronous cell cycle by wide-field Deltavision deconvolution fluorescence microscopy. Spc110–mCherry acted as the internal reference. Uncropped images of blots are shown in Supplementary Fig. S7.
Figure 3
Figure 3
Cnn1 protein–protein interactions and localization to the inner kinetochore. (a) SDS–PAGE gels depicting Cnn1 and co-purifying proteins. Cnn1 was tagged with a 3FLAG or GST epitope and expressed from PGAL1, which replaced the endogenous promoter of CNN1 (PGAL1–CNN1–3FLAG) or was placed on a 2 μ vector (pPGAL1–GST–CNN1). Both strains and the untagged parent (negative control) were grown in 2% galactose YP medium (23 °C). For purification details, see Methods. The left, central and right panels indicate peptides corresponding to Cnn1 (red) and enriched proteins (blue) that were identified by mass spectrometry following five, two or three washes of the affinity beads, respectively. The number of peptides and MASCOT scores of the enriched proteins were: left panel: Cnn1 (6, 5, 4, 4, 3, 2, 3, 2, 2; 384, 272, 195, 193, 148, 141, 126, 113, 80), Tub1 (6; 394), Tub2 (5; 346); central panel: Cnn1 (15, 10, 10, 6, 6, 6, 5, 4, 3, 3; 891, 602, 500, 343, 295, 288, 199, 182, 159, 126), Tub2 (4; 174), Spc25 (2; 90), Sgt1 (3, 134), Mtw1 (3; 125), Bik1 (3; 118); and right panel: Cnn1 (7, 7, 6, 4, 4; 423, 319, 298, 223, 213), Spc24 (3; 203) and Spc25 (8; 346). (b) Identification of Cnn1 interactors in Gal4-based Y2H screens. Cnn1 fragments (purple bars) were chosen from the predicted secondary structure of Cnn1 (plotted, www.ch.embnet.org/software/COILS_form.html) and tagged N- or C-terminally with the Gal4 DNA-binding domain (DBD). The bait constructs were screened against all S. cerevisiae ORFs tagged C-terminally with the Gal4 activation domain. The construct containing the first 150 residues of Cnn1 consistently interacted with Spc24, Spc25 and Ndc80 (Ndc80 complex). Cnn1 interacted only once with Duo1 (Dam1 complex; n.d., not determined). (c) Cnn1 interactors identified in affinity purifications (blue arrows, this study; dashed blue arrows, published,) and Y2H screens (red arrows: this study; dashed red arrows, published,). (d) Kinetochore localization of Cnn1 (purple ellipse) as revealed by CENIV ChIP (Supplementary Fig. S4). The blue arrows indicate the kinetochore recruitment pathways. Recruitment code: green, total dependence; orange, partial dependence; red, independence.
Figure 4
Figure 4
Cnn1 ensures a timely progression through S phase and promotes faithful chromosome transmission. (a) In the absence of Cnn1, S phase was reduced by 15 min (indicated by an orange bar next to the FACS profiles). Wild-type, cnn1Δ and PGAL1–CNN1 strains were grown in 2% raffinose YP medium (23 °C), synchronized in G1 (5 μg ml−1 α-factor), washed and released into 2% galactose YP medium. Cells were tracked by FACS (DNA content, right) and spindle morphology analysis (curves; anti-Tub1 immunofluorescence analysis). The levels of Pds1–3HA, whose degradation signals the metaphase–anaphase transition, were revealed by anti-HA western hybridization, as were the levels of 3HA–Cnn1 in the PGAL1–3HA–CNN1 strain. Pgk1 was the loading control (bottom blots). After 90 min, 2.5 μg ml−1 of α-factor was added to the culture to prevent the cells from entering a second cell cycle. (b) A lack or elevated levels of Cnn1 do not affect cell fitness. Wild-type, cnn1Δ and PGAL1–CNN1 strains were serially diluted on 2% glucose YP agar (represses PGAL1–CNN1) and on 2% galactose YP agar (induces PGAL1–CNN1). The plates were incubated for 2 d (glucose) or 3 d (galactose) at 23 °C. (c) A lack or slightly elevated levels of Cnn1 lead to mild chromosome loss. Chromosome missegregation was quantified by colony sectoring analysis with a centromeric ade3-2 reporter plasmid. In the cnn1Δ and PGAL1–CNN1 strains, a 2–3-fold increase in chromosome loss was measured in five independent experiments (n = 5). Kinetochore mutant ctf19Δ acted as the reference. The error bars= represent s.d. Uncropped images of blots are shown in Supplementary Fig. S7.
Figure 5
Figure 5
Cnn1 promotes the sister-chromatid/spindle binding and bi-orientation activity of the KMN network. (a) cnn1 genetically interacts with nnf1-17. The wild-type, nnf1-17, cnn1Δ, cnn1151–361, cnn1Δ nnf1-17 and cnn1151–361nnf1-17 strains were serially diluted on 2% glucose YP agar and incubated at 23 °C (permissive), 32 °C (semi-permissive) and 37 °C (non-permissive) for 2 days. (b) Cnn1 supports sister-chromatid/microtubule binding and bi-orientation. In wild-type, nnf1-17, cnn1Δ, cnn1151–361, cnn1Δ nnf1-17 and cnn1151–361 nnf1-17 strains, CENIII was placed under the control of PGAL1 and marked with 112 tetO2 tandem repeats. TETR–3ECFP was expressed from PURA3 to label CENIII fluorescently. Furthermore, tubulin was marked (1GFP–Tub1) and CDC20 was placed under the control of the methionine-repressible PMET3. Following growth in methionine dropout medium containing 2% raffinose, the cells were shifted to YP medium containing 2% galactose, 2% raffinose and 2 mM methionine (23 °C). Next, the temperature was set to 35 °C and the cells arrested in metaphase (owing to repression of CDC20 expression) without a kinetochore on CENIII (transcription from PGAL1 across CENIII prevented kinetochore formation on CENIII). They were immobilized in a glass-bottom dish and cultured in 2% glucose YP medium containing methionine (2 mM) to repress CENIII transcription. This triggered kinetochore formation on CENIII. Sister-chromatid-III/microtubule binding (green), its localization to the spindle pole (purple) and bi-orientation on the spindle (blue) were tracked for 41 min by time-lapse Deltavision deconvolution microscopy.The plots show averaged values measured in the indicated number (n) of cells. Red, sister chromatid III not captured by a microtubule; green, sister chromatid III captured by a microtubule; purple, sister chromatid III at spindle pole; blue, CENIII regions separated. (c) Still images from the CENIII-activation experiment plotted in b. Images depict cells (25 min after CENIII activation) with bi-oriented, mono-oriented or unbound sister chromatid III. Red, tubulin; double-headed arrow, spindle (red); arrowheads, CENIII (green dot). Scale bars, 3 μm.
Figure 6
Figure 6
Cnn1 inhibits the interaction between the KMN complexes. (a) Cnn1 does not recruit KMN complexes to centromeres. Endogenously expressed Dsn1–Citrine, Spc24–Citrine and Spc105–Citrine were quantified by spinning-disc confocal fluorescence imaging in asynchronous cultures of wild-type, cnn1Δ and PGAL1–CNN1 strains (2% galactose minimal medium, 23 °C). Cell-cycle stages are indicated; G1, S phase, metaphase (M) and anaphase (A). Fluorescence levels were normalized to those measured in the wild-type strain (value = 1.0). Spc110–mCherry acted as the internal reference. For each measurement, 50 kinetochores were analysed (n = 50). The error bars represent s.d. (b) Cnn1 inhibits the binding between the Mtw1, Spc105 and Ndc80 complexes. Spc105–3HA and Spc24–13Myc co-purifying with Dsn1–3FLAG from wild-type, cnn1Δ and PGAL1–CNN1 stains (2% galactose YP medium, 23 °C) were identified by anti-FLAG, anti-HA and anti-Myc western hybridization (left panels). The levels of Spc105–3HA and Spc24–13Myc co-purifying with Dsn1–3FLAG were quantified (ImageJ 1.43u) and normalized to those of Dsn1–3FLAG (right plot). The error bars represent s.d. (c) Cnn11–150 prevents the Mtw1 complex (Dsn1, Mtw1, Nsl1 and Nnf1) from binding to the Spc24–Spc25 dimer. Epitope-tagged recombinant proteins were incubated in various combinations as indicated in the rectangle (Spc25g, global domain of Spc25; residues 128–222). The single proteins and reaction mixtures were analysed by non-denaturing PAGE to visualize the relative positions of input proteins and formed complexes (indicated), and by denaturing SDS–PAGE to confirm protein purity and concentrations. Proteins were visualized with Gelcode blue. BSA, bovine serum albumin. Uncropped images of blots and gels are shown in Supplementary Fig. S7.

Comment in

  • T time for point centromeres.
    Gascoigne KE, Cheeseman IM. Gascoigne KE, et al. Nat Cell Biol. 2012 May 30;14(6):559-61. doi: 10.1038/ncb2509. Nat Cell Biol. 2012. PMID: 22561349

References

    1. Lampert F, Westermann S. A blueprint for kinetochores—new insights into the molecular mechanics of cell division. Nat. Rev. Mol. Cell Biol. 2011;12:407–412. - PubMed
    1. Tanaka K, et al. Molecular mechanisms of kinetochore capture by spindle microtubules. Nature. 2005;434:987–994. - PubMed
    1. Tanaka TU. Kinetochore-microtubule interactions: steps toward bi-orientation. EMBO J. 2010;29:4070–4082. - PMC - PubMed
    1. Cheeseman IM, Chappie JS, Wilson-Kubalek EM, Desai A. The conserved KMN network constitutes the core microtubule-binding site of the kinetochore. Cell. 2006;127:983–997. - PubMed
    1. Espeut J, et al. Microtubule binding by KNL-1 contributes to spindle checkpoint silencing at the kinetochore. J. Cell Biol. 2012;196:469–482. - PMC - PubMed

Publication types

MeSH terms

Substances