

Detectable clonal mosaicism from birth to old age and its relationship to cancer
- PMID: 22561516
- PMCID: PMC3366033
- DOI: 10.1038/ng.2271
Detectable clonal mosaicism from birth to old age and its relationship to cancer
Abstract
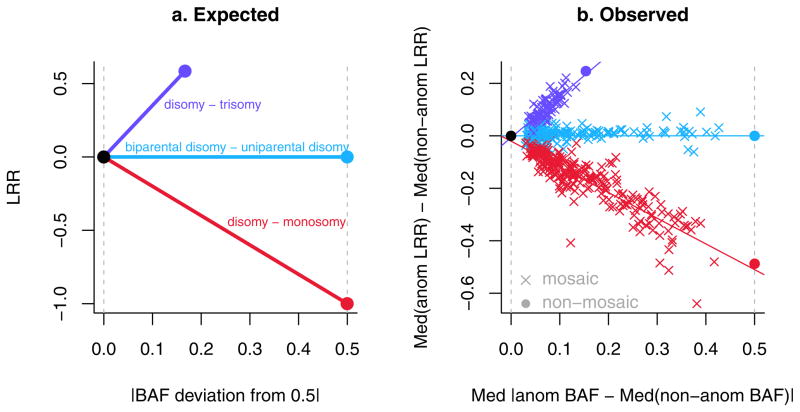
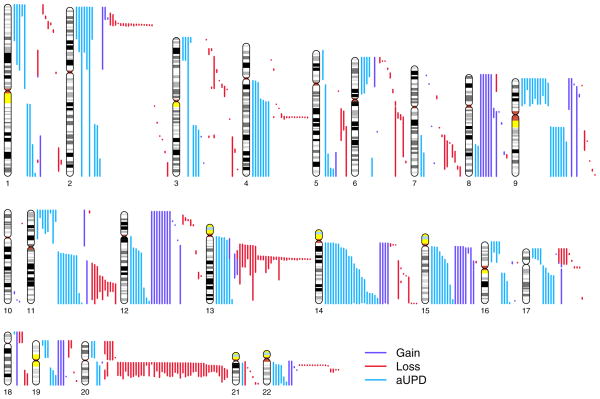
We detected clonal mosaicism for large chromosomal anomalies (duplications, deletions and uniparental disomy) using SNP microarray data from over 50,000 subjects recruited for genome-wide association studies. This detection method requires a relatively high frequency of cells with the same abnormal karyotype (>5-10%; presumably of clonal origin) in the presence of normal cells. The frequency of detectable clonal mosaicism in peripheral blood is low (<0.5%) from birth until 50 years of age, after which it rapidly rises to 2-3% in the elderly. Many of the mosaic anomalies are characteristic of those found in hematological cancers and identify common deleted regions with genes previously associated with these cancers. Although only 3% of subjects with detectable clonal mosaicism had any record of hematological cancer before DNA sampling, those without a previous diagnosis have an estimated tenfold higher risk of a subsequent hematological cancer (95% confidence interval = 6-18).
Conflict of interest statement
Laura J. Bierut served as a consultant for Pfizer Inc. in 2008 and is an inventor on the patent “Markers for Addiction” (US 20070258898) covering the use of certain SNPs in determining the diagnosis, prognosis, and treatment of addiction.
Figures


Comment in
-
Exploring the variation within.Nat Genet. 2012 May 29;44(6):614-6. doi: 10.1038/ng.2311. Nat Genet. 2012. PMID: 22641203
References
-
- Miller OJ, Therman E. Human Chromosomes. Vol. 501. Springer-Verlag; 2001.
-
- Strachan T, Read AP. Human Molecular Genetics. Wiley-Liss; New York: 1996.
-
- Nowell PC. The clonal evolution of tumor cell populations. Science. 1976;194:23–8. - PubMed
-
- Delhanty JD. Mechanisms of aneuploidy induction in human oogenesis and early embryogenesis. Cytogenet Genome Res. 2005;111:237–44. - PubMed
-
- Vanneste E, et al. Chromosome instability is common in human cleavage-stage embryos. Nat Med. 2009;15:577–83. - PubMed
Publication types
MeSH terms
Grants and funding
- CA54281/CA/NCI NIH HHS/United States
- R01 CA063464/CA/NCI NIH HHS/United States
- U01 DE018903/DE/NIDCR NIH HHS/United States
- P50 CA093459/CA/NCI NIH HHS/United States
- R01EY015872/EY/NEI NIH HHS/United States
- R01CA100264/CA/NCI NIH HHS/United States
- P01CA089392/CA/NCI NIH HHS/United States
- U01HG004726/HG/NHGRI NIH HHS/United States
- U01HG004438/HG/NHGRI NIH HHS/United States
- RC2 CA148085/CA/NCI NIH HHS/United States
- U01 HG004728/HG/NHGRI NIH HHS/United States
- U01 HG004438/HG/NHGRI NIH HHS/United States
- U10AA008401/AA/NIAAA NIH HHS/United States
- U01 HG004446/HG/NHGRI NIH HHS/United States
- CA1326792/CA/NCI NIH HHS/United States
- U01HG004738/HG/NHGRI NIH HHS/United States
- T32 CA09168/CA/NCI NIH HHS/United States
- Z01 CP010200/ImNIH/Intramural NIH HHS/United States
- U01HG004415/HG/NHGRI NIH HHS/United States
- R01EY015473/EY/NEI NIH HHS/United States
- U01 DE018993/DE/NIDCR NIH HHS/United States
- U01HG004735/HG/NHGRI NIH HHS/United States
- R37 HL 039693/HL/NHLBI NIH HHS/United States
- P01 GM099568/GM/NIGMS NIH HHS/United States
- R01 CA092447/CA/NCI NIH HHS/United States
- P01 CA089392/CA/NCI NIH HHS/United States
- HHMI/Howard Hughes Medical Institute/United States
- R01 DE014899/DE/NIDCR NIH HHS/United States
- U01 HG004424/HG/NHGRI NIH HHS/United States
- U01HG004728/HG/NHGRI NIH HHS/United States
- R01 HL039693/HL/NHLBI NIH HHS/United States
- U01 HG004415/HG/NHGRI NIH HHS/United States
- U01HG004422/HG/NHGRI NIH HHS/United States
- CA63464/CA/NCI NIH HHS/United States
- K08 DA032680/DA/NIDA NIH HHS/United States
- R01DA013423/DA/NIDA NIH HHS/United States
- HHSN268200-782096C/PHS HHS/United States
- HHSN268200782096C/HG/NHGRI NIH HHS/United States
- R01 DE016148/DE/NIDCR NIH HHS/United States
- U01 HG004422/HG/NHGRI NIH HHS/United States
- U01HG04424/HG/NHGRI NIH HHS/United States
- T32 CA009168/CA/NCI NIH HHS/United States
- R01 DA019963/DA/NIDA NIH HHS/United States
- R01DE014899/DE/NIDCR NIH HHS/United States
- R01 DA013423/DA/NIDA NIH HHS/United States
- U01DE018993/DE/NIDCR NIH HHS/United States
- U01HG004423/HG/NHGRI NIH HHS/United States
- R01 EY015473/EY/NEI NIH HHS/United States
- R01DA019963/DA/NIDA NIH HHS/United States
- R01 CA054281/CA/NCI NIH HHS/United States
- R29CA70334/CA/NCI NIH HHS/United States
- U01DE018903/DE/NIDCR NIH HHS/United States
- U01 CA063464/CA/NCI NIH HHS/United States
- R37 HL039693/HL/NHLBI NIH HHS/United States
- U01 HG004735/HG/NHGRI NIH HHS/United States
- P50CA093459/CA/NCI NIH HHS/United States
- U01 HG004738/HG/NHGRI NIH HHS/United States
- R01 EY015872/EY/NEI NIH HHS/United States
- U01 HG004423/HG/NHGRI NIH HHS/United States
- P30 EY014104/EY/NEI NIH HHS/United States
- U10 AA008401/AA/NIAAA NIH HHS/United States
- R01 CA100264/CA/NCI NIH HHS/United States
- R37 CA054281/CA/NCI NIH HHS/United States
- U01 HG004726/HG/NHGRI NIH HHS/United States
- KL2 TR000450/TR/NCATS NIH HHS/United States
LinkOut - more resources
Full Text Sources
Other Literature Sources
Medical
Molecular Biology Databases
