

Individually ventilated cages cause chronic low-grade hypoxia impacting mice hematologically and behaviorally
- PMID: 22561683
- PMCID: PMC3398166
- DOI: 10.1016/j.bbi.2012.04.008
Individually ventilated cages cause chronic low-grade hypoxia impacting mice hematologically and behaviorally
Abstract
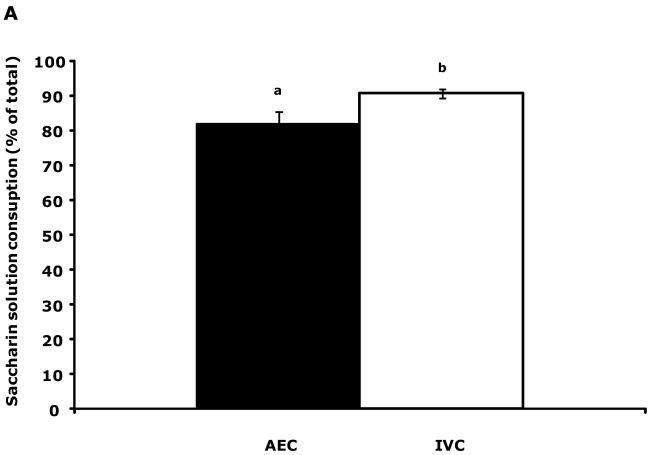
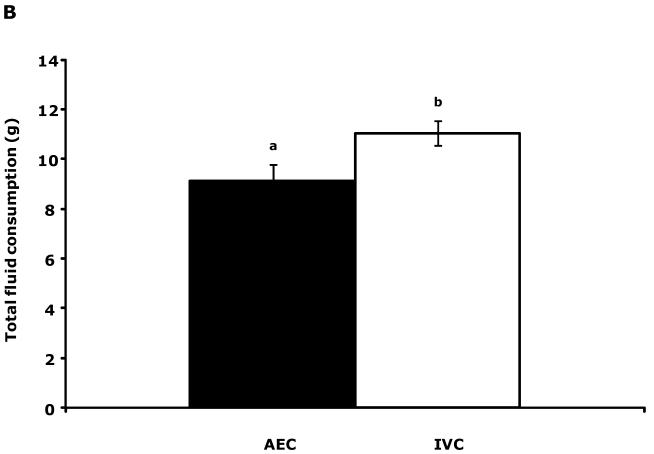
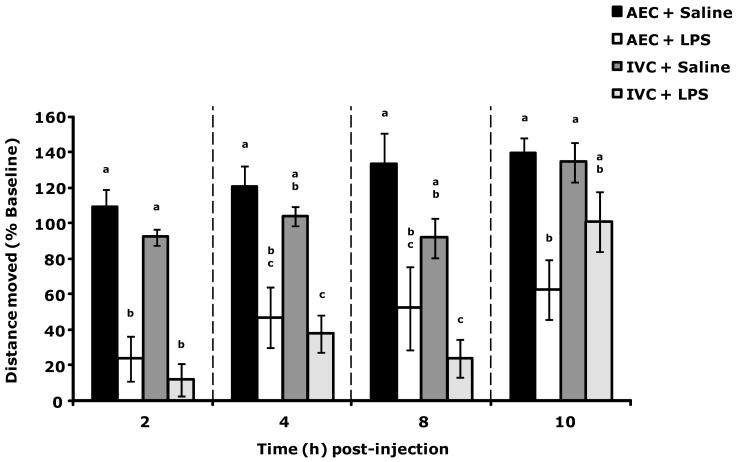
Use of individually ventilated caging (IVC) systems for mouse-based laboratory investigation has dramatically increased. We found that without mice present, intra-cage oxygen concentration was comparable (21%) between IVC housing and ambient environment caging (AEC) that used wire top lids. However, when mice were housed 4-to-a-cage for 1week, intra-cage oxygen dropped to 20.5% in IVC housing as compared to 21% for AEC housing. IVC intra-cage humidity was also elevated relative to AEC housing. Mice raised in IVC housing as compared to mice raised in AEC housing had higher RBC mass, hematocrit and hemoglobin concentrations. They also had elevated platelet counts but lower white blood cell counts. IVC mice, relative to AEC mice, had increased saccharin preference and increased fluid consumption but similar locomotion, food intake, social exploration and novel object recognition when tested in an AEC environment. Taken together, these data indicate that ventilated caging systems can have a 0.5% reduction from ambient oxygen concentration that is coupled to mouse red blood cell indices indicative of chronic exposure to a hypoxia. Importantly, IVC housing can impact behavioral testing for depressive-like behavior.
Copyright © 2012 Elsevier Inc. All rights reserved.
Figures
References
-
- Arendash GW, Cox AA, Mori T, Cracchiolo JR, Hensley KL, Roberts LJ., II. Oxygen treatment triggers cognitive impairment in Alzheimer’s transgenic mice. NeuroReport. 2009;20:1087–1092. - PubMed
-
- Barhke MS, Shukitt-Hale B. Effects of altitude on mood, behavior and cognitive functioning: a review. Sports Medicine. 1993;16:97–125. - PubMed
-
- Bennett JC, Plum F. Cecil textbook of medicine. W.B. Saunders Company; Philadelphia (PA): 1996.
-
- Callaham M. Hypoxic hazards of traditional paper bag rebreathing in hyperventilating patients. Ann Emer Med. 1989;18:622–628. - PubMed
-
- Casas H, Casas M, Ricart A, Rama R, Ibáñez J, Palacios L, Rodríguez FA, Ventura JL, Viscor G, Pagés T. Effectiveness of three short term intermittent hypobaric hypoxia protocols: hematological responses. J Excerc Physiol Online. 2000;3:38–45.
Publication types
MeSH terms
Substances
Grants and funding
LinkOut - more resources
Full Text Sources
