. 2012 Jun;18(6):918-25.
doi: 10.1038/nm.2757.

Retinaldehyde dehydrogenase 1 regulates a thermogenic program in white adipose tissue

Affiliations

Retinaldehyde dehydrogenase 1 regulates a thermogenic program in white adipose tissue

Florian W Kiefer et al. Nat Med. 2012 Jun.

Abstract

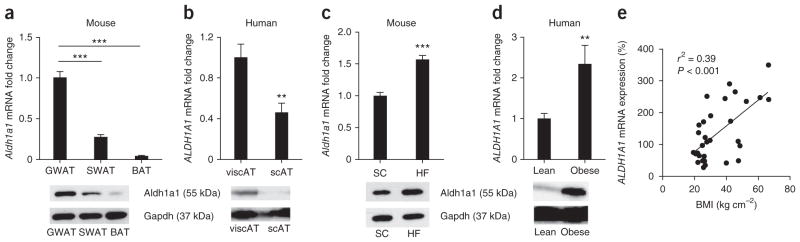
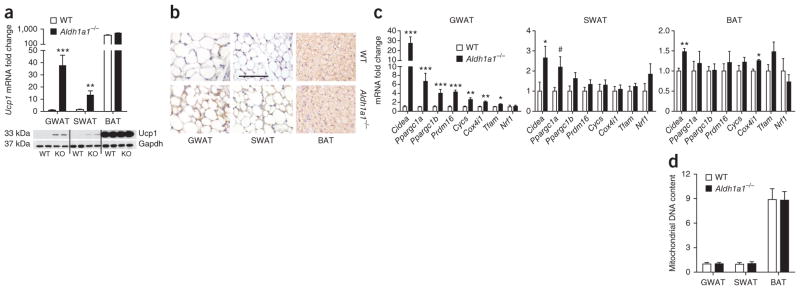
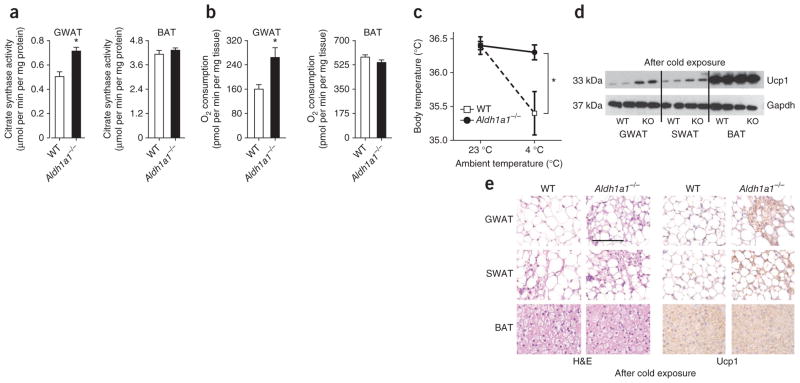
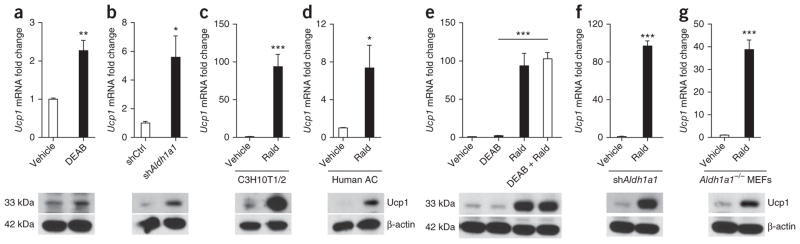
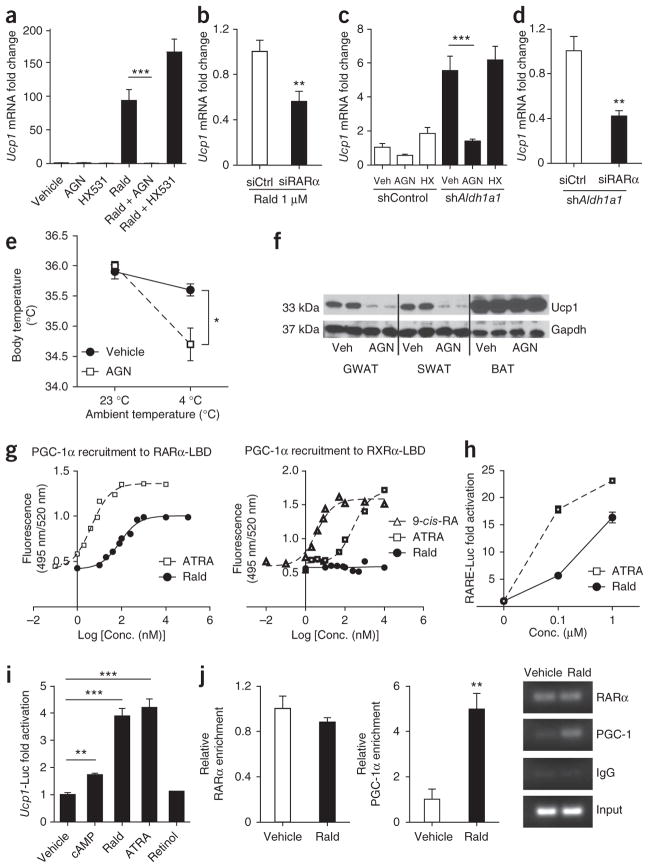
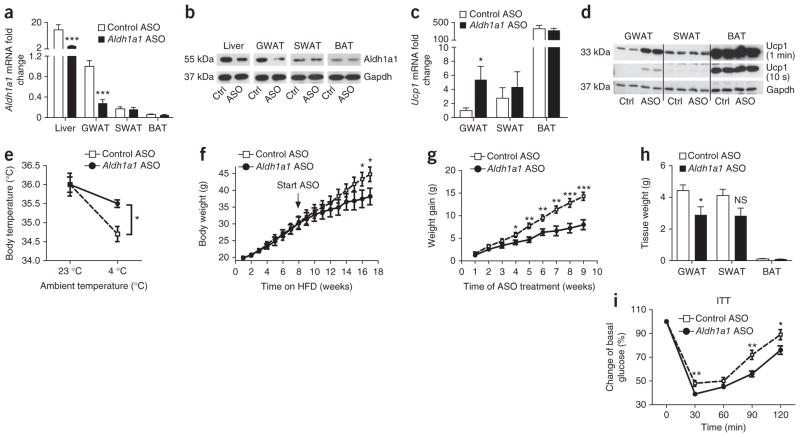
Promoting brown adipose tissue (BAT) formation and function may reduce obesity. Recent data link retinoids to energy balance, but a specific role for retinoid metabolism in white versus brown fat is unknown. Retinaldehyde dehydrogenases (Aldhs), also known as aldehyde dehydrogenases, are rate-limiting enzymes that convert retinaldehyde (Rald) to retinoic acid. Here we show that Aldh1a1 is expressed predominately in white adipose tissue (WAT), including visceral depots in mice and humans. Deficiency of the Aldh1a1 gene induced a BAT-like transcriptional program in WAT that drove uncoupled respiration and adaptive thermogenesis. WAT-selective Aldh1a1 knockdown conferred this BAT program in obese mice, limiting weight gain and improving glucose homeostasis. Rald induced uncoupling protein-1 (Ucp1) mRNA and protein levels in white adipocytes by selectively activating the retinoic acid receptor (RAR), recruiting the coactivator PGC-1α and inducing Ucp1 promoter activity. These data establish Aldh1a1 and its substrate Rald as previously unrecognized determinants of adipocyte plasticity and adaptive thermogenesis, which may have potential therapeutic implications.


Conflict of interest statement

COMPETING FINANCIAL INTERESTS

The authors declare no competing financial interests.

Figures

Figure 1
Figure 1
Aldh1a1 is present primarily in visceral fat, and its expression correlates with obesity. (a) Aldh1a1 mRNA and protein expression in different fat depots of female C57BL/6J mice (n = 10). (b) ALDH1A1 mRNA and protein expression in visceral adipose tissue (viscAT) and subcutaneous adipose tissue (scAT) from nonobese male and female subjects (n = 20). (c) Aldh1a1 mRNA and protein expression in GWAT from standard chow–fed (SC) lean and high-fat diet–fed (HF) obese C57BL/6J mice (n = 8 per group). (d) ALDH1A1 mRNA and protein expression in viscAT from nonobese (body-mass index (BMI) = 25.2 ± 0.15 kg m−2) and morbidly obese (BMI = 53.0 ± 0.55 kg m−2) subjects; n = 20 per group. Representative western blots are shown. (e) Linear regression analysis between BMI and ALDH1A1 mRNA expression in human viscAT (n = 40). **P < 0.01, ***P < 0.001. Data are given as mean ± s.e.m.
Figure 2
Figure 2
Aldh1a1 deficiency is characterized by increased transcription of brown fat markers in white fat. (a) Ucp1 mRNA expression and protein analysis in GWAT, SWAT and BAT of standard chow-fed WT and Aldh1a1−/− mice. (b) Immunohistochemical analysis of Ucp1 (brown staining) in GWAT, SWAT and BAT of WT and Aldh1a1−/− mice. Scale bar, 100 μm. (c) mRNA expression of classic brown fat markers in GWAT, SWAT and BAT of WT versus Aldh1a1−/− mice. (d) Mitochondrial DNA content (genomic ND1 expression) determined in GWAT, SWAT and BAT of WT versus Aldh1a1−/− mice. n = 6–8 per group. #P = 0.07, *P < 0.05, **P < 0.01, ***P < 0.001. Data are given as mean ± s.e.m.
Figure 3
Figure 3
Aldh1a1 deficiency activates a thermogenic program in white fat. (a, b) Citrate synthase activity (a) and oxygen consumption rate (b) in GWAT and BAT of WT versus Aldh1a1−/− mice as measured by enzymatic assays and the Seahorse Extracellular Flux Analyzer, respectively. (c) Core body temperature of WT versus Aldh1a1−/− mice. Results represent average body temperature over a 48-h period at 23 °C and 4 °C, respectively. (d, e) Representative Ucp1 western blot (d) and H&E and immunohistochemical Ucp1 staining (e) in GWAT, SWAT and BAT of WT versus Aldh1a1−/− (KO) mice after 48 h of cold stimulation. n = 6–8 per group, *P < 0.05. Scale bar, 100 μm. Data are given as mean ± s.e.m.
Figure 4
Figure 4
Rald induces Ucp1 expression in white adipocytes. (a) Ucp1 mRNA expression and protein levels in 10T1/2 cells after adipocyte differentiation in the presence or absence of the Aldh inhibitor DEAB (1 μM). (b) Ucp1 mRNA and protein analysis in differentiated 10T1/2 cells stably transfected with scrambled (shCtrl) or Aldh1a1-targeting (shAldh1a1) shRNA. (c, d) Ucp1 mRNA and protein analysis in 10T1/2 cells (c) and human stromal-vascular cells (d) from subcutaneous fat biopsies, differentiated into adipocytes in the presence or absence of Rald (1 μM). (e) Ucp1 gene expression and protein content in differentiated 10T1/2 cells stimulated with DEAB (1 μM), Rald (1 μM) or both. (f, g) shAldh1a1-transfected 10T1/2 cells (f) and MEFs (g) isolated from Aldh1a1-deficient embryos were stimulated with Rald (1 μM) during adipogenic differentiation followed by Ucp1 mRNA and protein analysis. n = 5 or 6 per condition, *P < 0.05, **P < 0.01, ***P < 0.001. Data are given as mean ± s.e.m.
Figure 5
Figure 5
Rald-mediated Ucp1 expression is RAR-dependent and involves PGC-1α recruitment. (a) Ucp1 mRNA expression in 10T1/2 adipocytes stimulated with either the RAR antagonist AGN193109 (AGN), the RXR antagonist HX531, Rald (1 μM) or the combination of Rald + AGN or Rald + HX531 (each 1 μM). (b) Ucp1 mRNA quantification in 10T1/2 adipocytes transiently transfected with scrambled (siCtrl) or Rara siRNA (siRARα) and stimulated with Rald (1 μM). (c) Ucp1 mRNA quantification in shControl and shAldh1a1-transfected 10T1/2 adipocytes stimulated with AGN193109 or HX531 (both 1 μM). (d) Ucp1 mRNA analysis in Aldh1a1 knockdown 10T1/2 cells (shAldh1a1) transfected with siCtrl or siRARα. (e) Core body temperature in Aldh1a1−/− mice injected with the RAR antagonist AGN193109 or vehicle for 2 weeks. Results represent average body temperature over a 48-h period at 23 °C and 4 °C, respectively. (f) Western blot for Ucp1 in vehicle- and AGN-treated Aldh1a1−/− mice after cold exposure. (g) Ligand-dependent recruitment of PGC-1α to either the RARα-LBD or RXRα-LBD, respectively, as determined by cell-free TR-FRET assays. Dose-response curves for Rald, ATRA and 9-cis–retinoic acid (9-cis-RA) are shown. (h) Undifferentiated 10T1/2 cells, which lack Aldhs, were transfected with an RARE-luciferase construct (RARE-Luc) followed by stimulation (24 h) with increasing concentrations of Rald or ATRA and luciferase activity assays. (i) Undifferentiated 10T1/2 cells were transfected with a mouse 3.1-kb Ucp1 promoter luciferase construct (Ucp1-Luc) and subsequently stimulated (24 h) with cAMP (250 μM), Rald, ATRA and retinol (each 1 μM). Normalized luciferase activities are shown as fold change. (j) RARα and PGC-1α recruitment to the Ucp1 promoter region in Rald-stimulated (1 μM) 10T1/2 adipocytes analyzed by ChIP. Fold enrichment and a representative DNA gel pictures are given. n = 5 or 6 per condition, *P < 0.05,**P < 0.01, ***P < 0.001; Veh, vehicle. Data are given as mean ± s.e.m.
Figure 6
Figure 6
ASO-mediated Aldh1a1 knockdown in GWAT promotes white-fat thermogenesis and limits diet-induced obesity. C57BL/6J mice on standard chow diet were injected with Aldh1a1 ASO and control ASO (Ctrl ASO) for 6 weeks (two doses of 35 mg per kg of body weight per week, i.p., n = 8 per group). (a, b) Aldh1a1 mRNA (a) and protein (b) expression in the indicated tissues of mice treated with Aldh1a1 ASO or control ASO (Ctrl, Ctrl ASO; ASO, Aldh1a1 ASO). (c, d) Ucp1 mRNA (c) and protein (d) levels in GWAT, SWAT and BAT of mice treated with Aldh1a1 ASO versus control ASO. (e) Core body temperature of mice treated with Aldh1a1 ASO versus control ASO at 23 °C and at 4 °C over 48 h (n = 6 per group). (fi) A cohort of C57BL/6J mice (n = 16) was fed a high-fat diet (HFD) for 8 weeks before initiation of Aldh1a1 ASO or control ASO treatment (n = 8 per group), continued HFD, and measurement of body weight gain (f, g), fat depot mass (h) and insulin tolerance testing (at 17 weeks) (i). *P < 0.05, **P < 0.01, ***P < 0.001. Data are given as mean ± s.e.m. NS, not significant.

References

    1. Mensah GA, et al. Obesity, metabolic syndrome, and type 2 diabetes: emerging epidemics and their cardiovascular implications. Cardiol Clin. 2004;22:485–504. - PubMed
    1. Bray GA, Bellanger T. Epidemiology, trends, and morbidities of obesity and the metabolic syndrome. Endocrine. 2006;29:109–117. - PubMed
    1. Klein S, et al. Waist circumference and cardiometabolic risk: a consensus statement from shaping America’s health: Association for Weight Management and Obesity Prevention; NAASO, the Obesity Society; the American Society for Nutrition; and the American Diabetes Association. Diabetes Care. 2007;30:1647–1652. - PubMed
    1. Cannon B, Nedergaard J. Brown adipose tissue: function and physiological significance. Physiol Rev. 2004;84:277–359. - PubMed
    1. Farmer SR. Molecular determinants of brown adipocyte formation and function. Genes Dev. 2008;22:1269–1275. - PMC - PubMed

Publication types

MeSH terms