

A pilot exploration of symptom trajectories in adolescents with cancer during chemotherapy
- PMID: 22561919
- PMCID: PMC3416951
- DOI: 10.1097/NCC.0b013e318250da1a
A pilot exploration of symptom trajectories in adolescents with cancer during chemotherapy
Abstract
Background: Chemotherapy is frequently administered in repetitive cycles. Adolescents with cancer have multiple symptoms related to chemotherapy, but knowledge of symptom trajectories across a cycle is limited. Examining trajectories over a cycle may reveal key periods to manage symptoms.
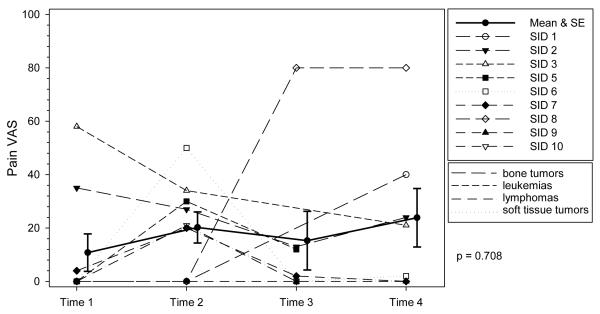
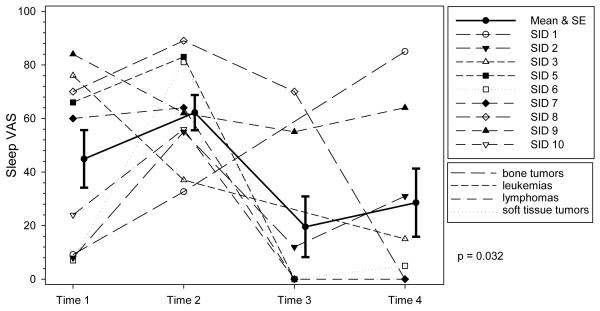
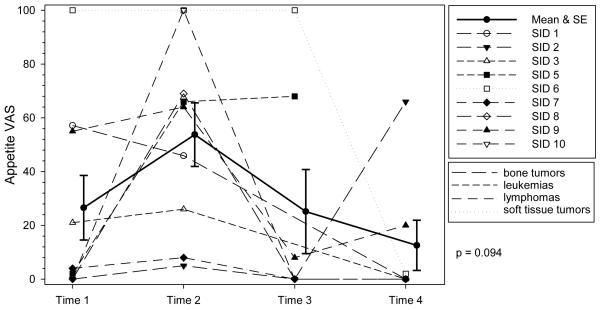
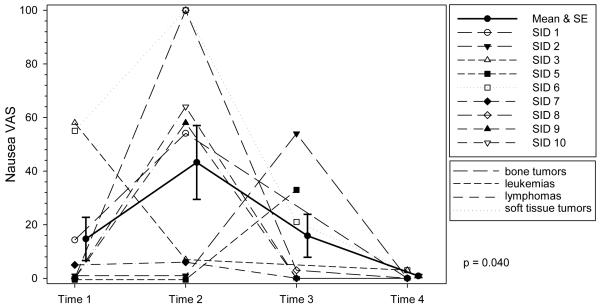
Objectives: The aims of this pilot were to describe the trajectory of symptoms (pain, sleep, appetite, nausea, fatigue) and biological and behavioral variables (anxiety, stress, hematologic function) across 1 cycle and examine relationships between variables.
Methods: Nine adolescents with cancer within 6 months of diagnosis participated. Data were collected by surveys, chart review, and biologic measures on days 1 and 2 of the cycle, 1 week later (nadir), and day 1 of the following cycle. To evaluate the trajectory, a simple random-effects repeated-measures analysis was computed.
Results: The significant trajectories were fatigue (P = .003), difficulty sleeping (P = .032), and nausea (P = .04). Most of the adolescents reported some anticipatory anxiety about receiving chemotherapy. Significant correlations between symptoms and biobehavioral variables included anticipatory anxiety and nausea (r = .86, P = .003), trait anxiety and fatigue (r = -0.82, P < .001), and stress and pain (r = 0.78, P = .039).
Conclusions: Multiple symptoms were experienced across the cycle. Three symptoms displayed significant trajectories indicating that patterns of symptoms may be anticipated.
Implications for practice: Pilot findings suggest that monitoring symptoms, stress, and anxiety across a cycle is important, not only during chemotherapy administration, but also prior to being admitted for chemotherapy.
Figures

References
-
- Hinds PS, Hockenberry-Eaton M, Rai SN, et al. Clinical field testing of an enhanced-activity intervention in hospitalized children with cancer. J Pain Symptom Manage. 2007;33(6):686–697. - PubMed
-
- Schneider SM, Workman ML. Effects of virtual reality on symptom distress in children receiving chemotherapy. Cyberpsychol & Behavior. 1999;2(2):125–134. - PubMed
-
- Hinds PS. Adolescent-focused oncology nursing research. Oncol Nurs Forum. 2004;31(2):281–287. - PubMed
-
- Paterson BL. The shifting perspectives model of chronic illness. J Nurs Scholarsh. 2001;33:21–26. - PubMed
-
- Ljungman G, Gordh T, Sorensen S, Kreuger A. Pain variations during cancer treatment in children: a descriptive survey. Pediatr Hematol Oncol. 2000;17(3):211–221. - PubMed
Publication types
MeSH terms
Substances
Grants and funding
LinkOut - more resources
Full Text Sources
Other Literature Sources
Medical
