

Spirometric predictors of lung function decline and mortality in early chronic obstructive pulmonary disease
- PMID: 22561963
- PMCID: PMC5448583
- DOI: 10.1164/rccm.201202-0223OC
Spirometric predictors of lung function decline and mortality in early chronic obstructive pulmonary disease
Abstract
Rationale: The course of lung function decline for smokers with early airflow obstruction remains undefined. It is also unclear which early spirometric characteristics identify individuals at risk for rapid decline and increased mortality.
Objectives: To determine the association between spirometric measures and 5-year decline in FEV(1) and 12-year mortality.
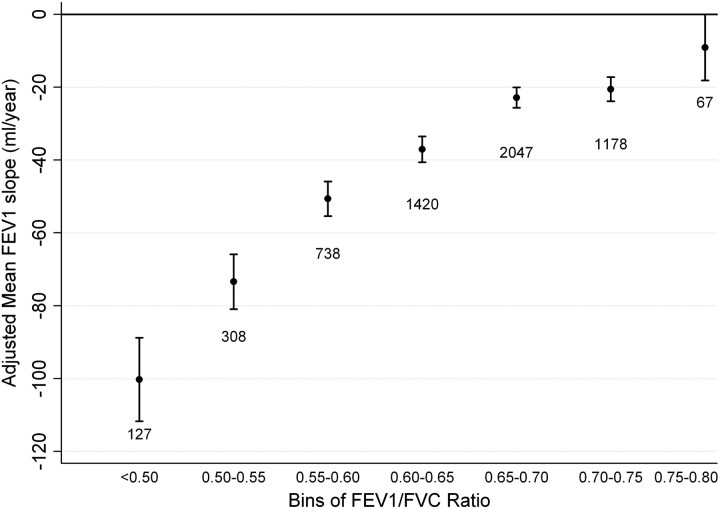
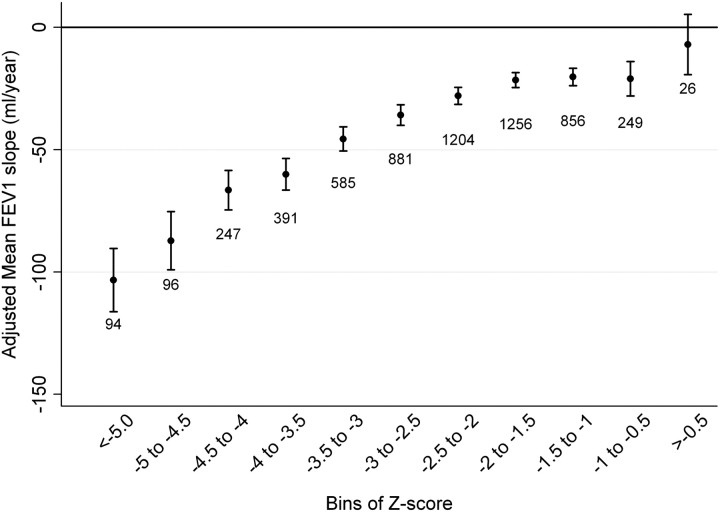
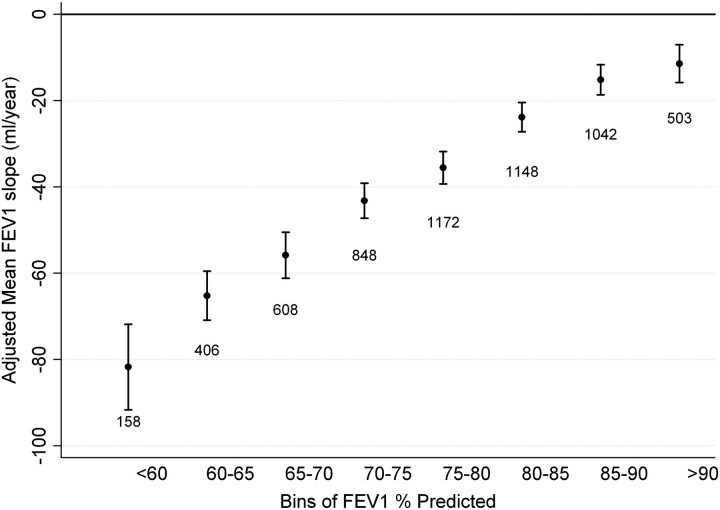
Methods: We analyzed longitudinal data from the Lung Health Study, a clinical trial of intensive smoking cessation intervention with or without bronchodilator therapy in 5,887 smokers with mild to moderate airflow obstruction. Participants were stratified into bins of baseline FEV(1) to FVC ratio, using bins of 5%, and separately into bins of Z-score (difference between actual and predicted FEV(1)/FVC, normalized to SD of predicted FEV(1)/FVC). Associations between spirometric measures and FEV(1) decline and mortality were determined after adjusting for baseline characteristics and time-varying smoking status.
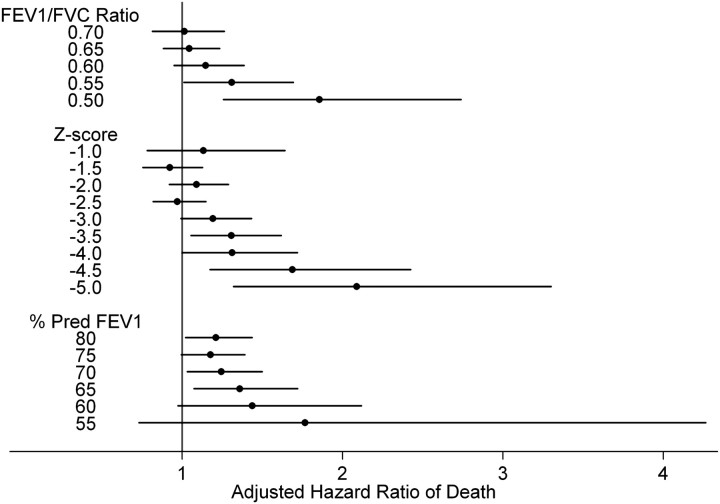
Measurements and main results: The cohort was approximately two-thirds male, predominantly of white race (96%), and with mean age of 49 ± 7 years. In general, individuals with lower lung function by any metric had more rapid adjusted FEV(1) decline. A threshold for differential decline was present at FEV(1)/FVC less than 0.65 (P < 0.001) and Z-score less than -2 (2.3 percentile) (P < 0.001). At year 12, 575 (7.2%) of the cohort had died. Lower thresholds of each spirometric metric were associated with increasing adjusted hazard of death.
Conclusions: Smokers at risk or with mild to moderate chronic obstructive pulmonary disease have accelerated lung function decline. Individuals with lower baseline FEV(1)/FVC have more rapid decline and worse mortality.
Figures
Comment in
-
Prognostic value of functional decline in middle-aged smokers.Am J Respir Crit Care Med. 2013 May 1;187(9):1029. doi: 10.1164/rccm.201210-1862LE. Am J Respir Crit Care Med. 2013. PMID: 23634863 No abstract available.
-
Reply: Prognostic value of functional decline in middle-aged smokers.Am J Respir Crit Care Med. 2013 May 1;187(9):1029. doi: 10.1164/rccm.201301-0104LE. Am J Respir Crit Care Med. 2013. PMID: 23634864 Free PMC article. No abstract available.
References
-
- Kochanek KD, Xu J, Murphy SL, Minino AM, Kung H. Deaths: preliminary data for 2009. Natl Vital Stat Rep 2011;59:1–51. - PubMed
-
- Tashkin DP, Celli B, Senn S, Burkhart D, Kesten S, Menjoge S, Decramer M. A 4-year trial of tiotropium in chronic obstructive pulmonary disease. N Engl J Med 2008;359:1543–1554. - PubMed
-
- Calverley PM, Anderson JA, Celli B, Ferguson GT, Jenkins C, Jones PW, Yates JC, Vestbo J. Salmeterol and fluticasone propionate and survival in chronic obstructive pulmonary disease. N Engl J Med 2007;356:775–789. - PubMed
-
- Vestbo J, Edwards LD, Scanlon PD, Yates JC, Agusti A, Bakke P, Calverley PM, Celli B, Coxson HO, Crim C, et al. Changes in forced expiratory volume in 1 second over time in COPD. N Engl J Med 2011;365:1184–1192. - PubMed
Publication types
MeSH terms
Grants and funding
LinkOut - more resources
Full Text Sources
Other Literature Sources
Medical
