Correlation between coronary perfusion pressure and quantitative ECG waveform measures during resuscitation of prolonged ventricular fibrillation
- PMID: 22562057
- PMCID: PMC3443288
- DOI: 10.1016/j.resuscitation.2012.04.013
Correlation between coronary perfusion pressure and quantitative ECG waveform measures during resuscitation of prolonged ventricular fibrillation
Abstract
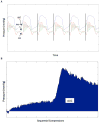
Introduction: The ventricular fibrillation (VF) waveform is dynamic and predicts defibrillation success. Quantitative waveform measures (QWMs) quantify these changes. Coronary perfusion pressure (CPP), a surrogate for myocardial perfusion, also predicts defibrillation success. The relationship between QWM and CPP has been preliminarily explored. We sought to further delineate this relationship in our porcine model and to determine if it is different between animals with/without ROSC (return of spontaneous circulation).
Hypothesis: A relationship exists between QWM and CPP that is different between animals with/without ROSC.
Methods: Utilizing a prior experiment in our porcine model of prolonged out-of-hospital VF cardiac arrest, we calculated mean CPP, cumulative dose CPP, and percent recovery of three QWM during resuscitation before the first defibrillation: amplitude spectrum area (AMSA), median slope (MS), and logarithm of the absolute correlations (LAC). A random effects linear regression model with an interaction term CPP ROSC investigated the association between CPP and percent recovery QWM and how this relationship changes with/without ROSC.
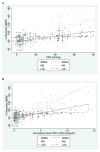
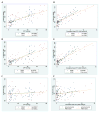
Results: For 12 animals, CPP and QWM measures (except LAC) improved during resuscitation. A linear relationship existed between CPP and percent recovery AMSA (coefficient 0.27; 95%CI 0.23, 0.31; p<0.001) and percent recovery MS (coefficient 0.80; 95%CI 0.70, 0.90; p<0.001). A linear relationship existed between cumulative dose CPP and percent recovery AMSA (coefficient 2.29; 95%CI 2.0, 2.56; p<0.001) and percent recovery MS (coefficient 6.68; 95%CI 6.09, 7.26; p<0.001). Animals with ROSC had a significantly "steeper" dose-response relationship.
Conclusions: There is a linear relationship between QWM and CPP during chest compressions in our porcine cardiac arrest model that is different between animals with/without ROSC.
Copyright © 2012 Elsevier Ireland Ltd. All rights reserved.
Conflict of interest statement
Conflict of Interest Statement
Disclosures: Dr. Menegazzi is a co-inventor of a patented quantitative method of ECG analysis (the scaling exponent), which has been licensed to Medtronic Physio-Control, from which he receives royalties. To avoid potential conflict of interest, the scaling exponent was not utilized in data analysis for this manuscript. Neither of the other authors have anything to disclose.
Figures


References
-
- Weisfeldt ML, Becker LB. Resuscitation after cardiac arrest: a 3-phase time-sensitive model. JAMA. 2002;288:3035–8. - PubMed
-
- Cobb LA, Fahrenbruch CE, Walsh TR, et al. Influence of cardiopulmonary resuscitation prior to defibrillation in patients with out-of-hospital ventricular fibrillation. JAMA. 1999;281:1182–8. - PubMed
-
- Wik L, Hansen TB, Fylling F, et al. Delaying defibrillation to give basic cardiopulmonary resuscitation to patients with out-of-hospital ventricular fibrillation: a randomized trial. JAMA. 2003;289:1389–95. - PubMed
-
- Berg RA, Hilwig RW, Ewy GA, Kern KB. Precoutnershock cardiopulmonary resuscitation improves initial response to defibrillation from prolonged ventricular fibrillation: a randomized, controlled swine study. Critical Care Medicine. 2004;32:1352–7. - PubMed
-
- Neumar RW, Brown CG, Van Ligten P, Hoekstra J, Altschuld RA, Baker P. Estimation of myocardial ischemic injury during ventricular fibrillation with total circulatory arrest using high-energy phosphates and lactate as metabolic markers. Ann Emerg Med. 1991;20:222–9. - PubMed
Publication types
MeSH terms
Grants and funding
LinkOut - more resources
Full Text Sources
Medical

