. 2012 May;5(5):788-97.
doi: 10.1158/1940-6207.CAPR-12-0004-T.

Caffeic acid phenethyl ester suppresses the proliferation of human prostate cancer cells through inhibition of p70S6K and Akt signaling networks

Affiliations

Caffeic acid phenethyl ester suppresses the proliferation of human prostate cancer cells through inhibition of p70S6K and Akt signaling networks

Chih-Pin Chuu et al. Cancer Prev Res (Phila). 2012 May.

Abstract

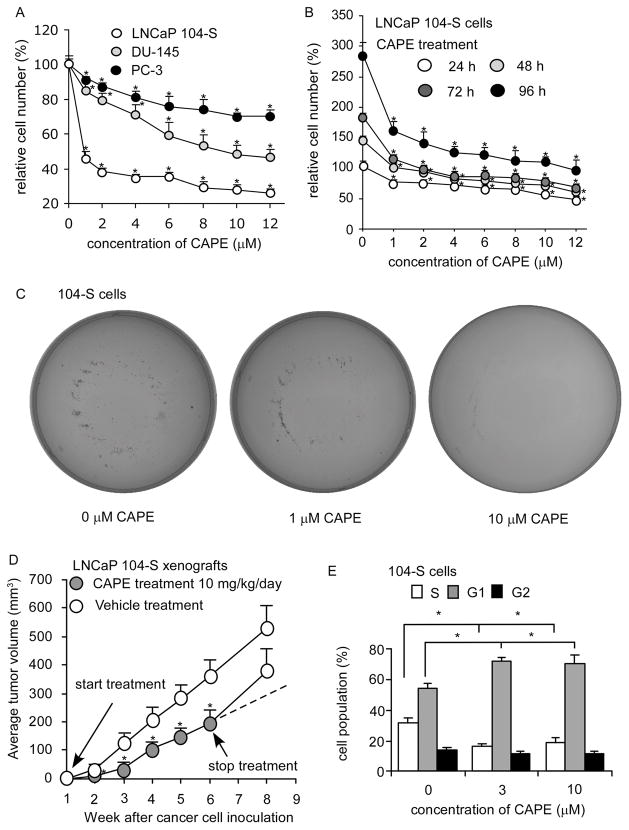
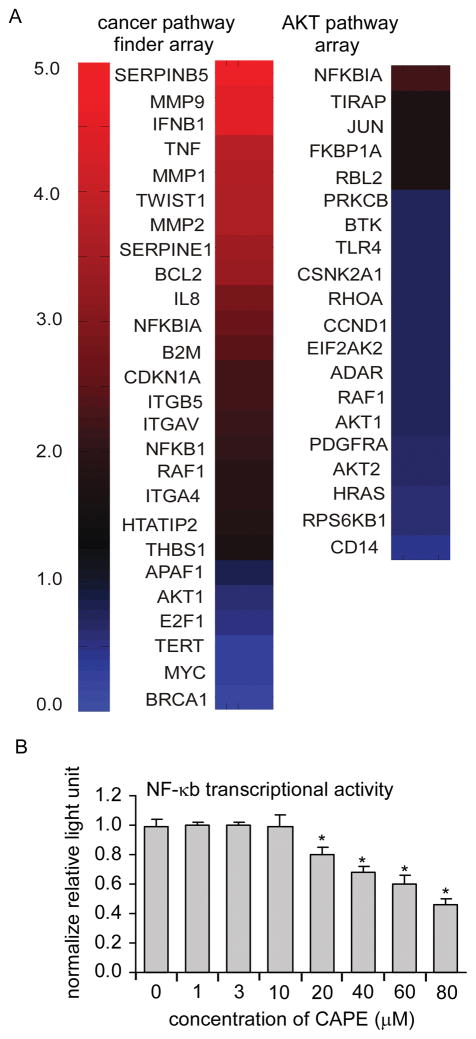
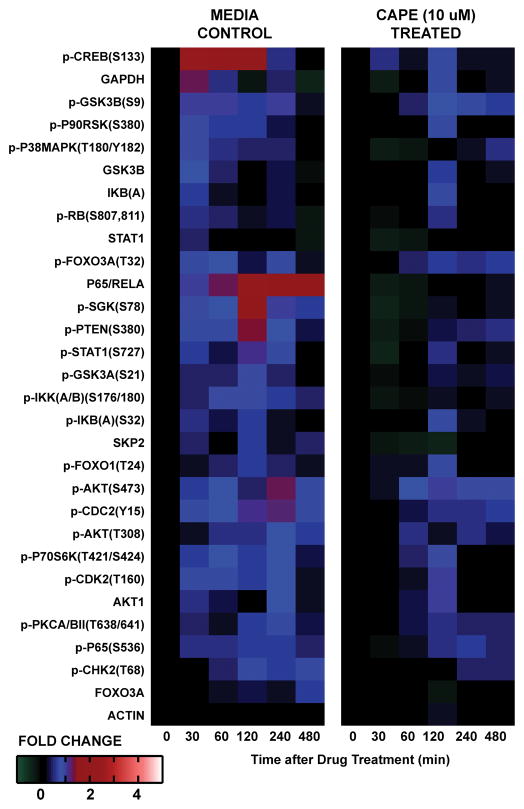
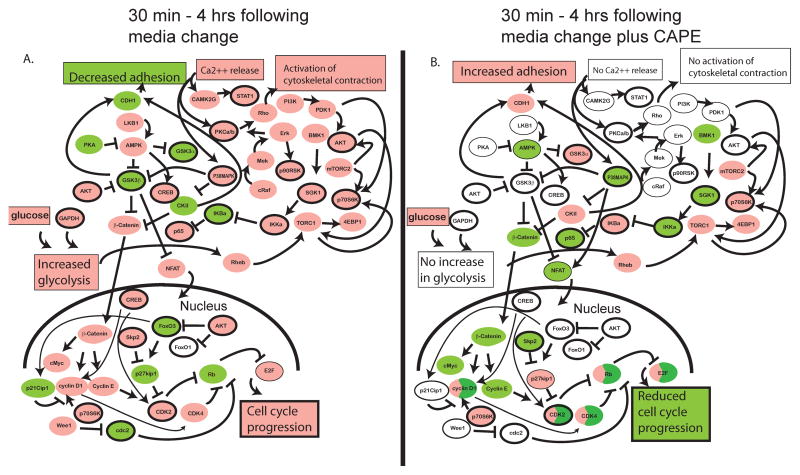
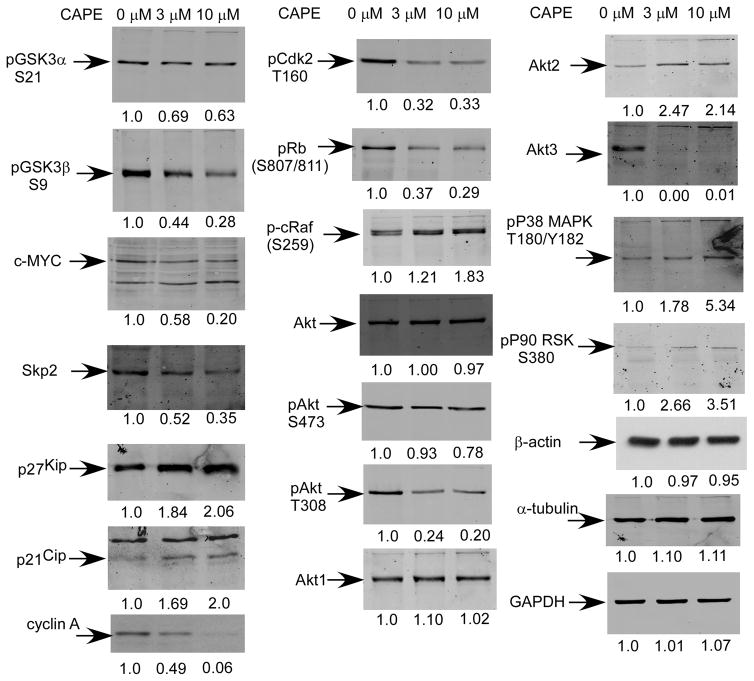
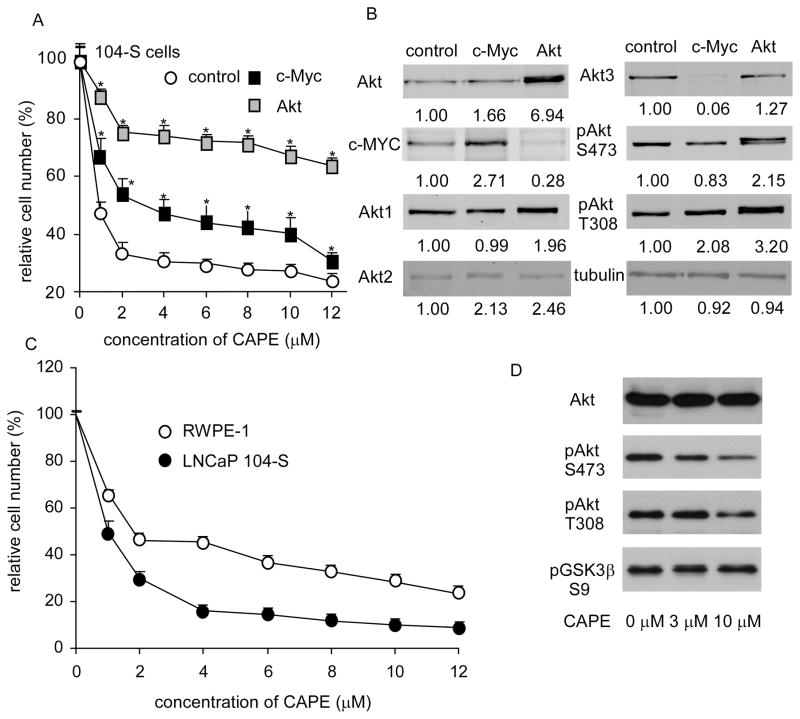
Caffeic acid phenethyl ester (CAPE) is a bioactive component derived from honeybee hive propolis. CAPE has been shown to have antimitogenic, anticarcinogenic, and other beneficial medicinal properties. Many of its effects have been shown to be mediated through its inhibition of NF-κB signaling pathways. We took a systematic approach to uncover the effects of CAPE from hours to days on the signaling networks in human prostate cancer cells. We observed that CAPE dosage dependently suppressed the proliferation of LNCaP, DU-145, and PC-3 human prostate cancer cells. Administration of CAPE by gavage significantly inhibited the tumor growth of LNCaP xenografts in nude mice. Using LNCaP cells as a model system, we examined the effect of CAPE on gene expression, protein signaling, and transcriptional regulatory networks using micro-Western arrays and PCR arrays. We built a model of the impact of CAPE on cell signaling which suggested that it acted through inhibition of Akt-related protein signaling networks. Overexpression of Akt1 or c-Myc, a downstream target of Akt signaling, significantly blocked the antiproliferative effects of CAPE. In summary, our results suggest that CAPE administration may be useful as an adjuvant therapy for prostate and potentially other types of cancers that are driven by the p70S6K and Akt signaling networks.


Figures

Figure 1
Figure 1. CAPE suppressed proliferation of prostate cancer cells in vitro and in vivo
(A) LNCaP, PC-3, and DU-145 cells were treated with increasing concentrations of CAPE for 96 h to determine suppressive effect of CAPE on prostate cancer cell lines. (B) LNCaP 104-S cells were treated with increasing concentrations of CAPE for 24, 48, 72, 96 h to investigate the suppressive effects of CAPE. Relative cell number was normalized to cell number of control (no treatment) at 24 h. (*) represented that cell number difference was statistically significant (p < 0.05) compared to that of control (no treatment) at the same time period. (C) Anticancer effect of CAPE was determined by a colony formation assay of LNCaP 104-S cells treated with 0, 1, 10 μM for 14 days. Image is representative of three biological replicates. (D) LNCaP 104-S cells were injected subcutaneously into athymic mice to form tumors. CAPE (10 mg/kg/day in sesame oil) or vehicle (sesame oil) was administered by gavage starting one week after cancer cell injection. Tumor volume of mice carrying 104-S xenografts was measured weekly. CAPE and vehicle treatment were stopped at 6th week and tumors were allowed to grow for another two weeks. Dashed line represents expected tumor growth if CAPE treatment continued. Tumor volume was shown as volume plus standard error (SE). (E) LNCaP 104-S cells were treated with CAPE for 96 h, harvested, and stained with propidium iodide dye for flow cytometric analysis of cell cycle distribution. (*) represents statistically significant difference (p < 0.05) between the two group of cells being compared.
Figure 2
Figure 2. CAPE caused reduction in expression of genes involved in cell proliferation and Akt signaling in LNCaP cells
104-S cells were treated with 0 or 10 μM CAPE for 48 h and mRNA was extracted and analyzed by PCR arrays for quantitative analysis of mRNA expression of genes related to cancer and the Akt pathway. Heatmap indicates the fold change of mRNA of CAPE treated LNCaP 104-S cells compared to control 104-S cells after 96 hr. A value of 1.0 means no change. Values less than 1.0 indicate a decrease in expression while values greater than 1.0 indicate increased expression. Experiments were performed with 4 biological replicates and 1–2 technical replicates per each sample. The left column displays the significantly changed genes from the Cancer Pathway Finder PCR Array while the second column displays genes significantly changed from the PI3K/Akt signaling PCRArray. Data for this figure can be found in Supp. Table 1.
Figure 3
Figure 3. Heatmap of protein abundance and phosphorylation fold changes measured by Micro-Western Arrays following replenishment of androgen-containing growth medium in the absence (left) or presence (right) of 10 μM CAPE treatment in LNCaP 104-S cells
Medium of 104-S cells was replaced with fresh medium containing 8% FBS DMEM plus 1 nM dihydrotestosterone (DHT) in the absence (left) or presence (right) of 10 μM CAPE. Cell lysates were collected prior to treatment (0 min), and following 30, 60, 120, 240, and 480 min. Micro-Western Arrays were performed to measure the changes in abundance and modification of indicated proteins. Proteins were organized in the y-axis of the heatmap based on time of maximal fold change amplitude. Time course graphs depicting signal to noise ratio and standard deviation of three technical replicates for each measurement are shown in Supp. Fig 1, and Supp. Table 2.
Figure 4
Figure 4. Putative model of CAPE describing the cause-effect relationship of the activity of 19 measured and 27 inferred proteins in LNCaP 104-S cells following addition of fresh serum-containing growth medium in the absence (A) or presence (B) of 10 μM CAPE in the time between 0 minutes and 4 hours
Protein nodes measured in the Micro-Western Array experiment were arranged in the figure along with unmeasured protein nodes based on relationships suggested from the literature. Nodes with measured or inferred up-regulation in activity are colored pink. Those with a measured or inferred down-regulation in activity are colored green. Those with no measured or inferred change are colored white. Those proteins downstream of opposing influences are colored half green and half pink. Measured nodes have a deep black outline while inferred (unmeasured) nodes have no black outline (in the case of colored nodes) or a thin black outline (in the case of non-colored nodes). Protein nodes are depicted in small ovals while cellular behaviors are depicted in large boxes.
Figure 5
Figure 5. CAPE treatment resulted in decreased abundance and phosphorylation of proteins in cell cycle regulation and AKT signaling in LNCaP 104-S cells following 96 h treatment
Protein expression of phospho-GSK3α S21, phospho-GSK3β S9, c-Myc, Skp2, p27Kip1, p21Cip1, cyclin A, pCdk2 T160, phospho-Rb (S807/811), phospho-c-Raf S259, total Akt, phospho-Akt S473, phospho-Akt T308, Akt1, Akt2, Akt3, phospho-P38 MAPK T180/Y182, phospho-P90 RSK S380, β-actin, α-tubulin, and GAPDH in 104-S cells treated with 0, 3, and 10 μM CAPE for 96 h were assayed by Western blotting. Graphical representations of mean and standard deviation are presented in Supplemental Figure 2.
Figure 6
Figure 6. Over-expression of Akt and c-Myc blocked the suppressive effect of CAPE on proliferation and CAPE blocked AR transcriptional activity
(A) 104-S cells overexpressing Akt1 or c-Myc were treated with increasing concentrations of CAPE for 96 hr and analyzed by 96-well proliferation assay. (B) Protein expression of Akt, c-Myc, Akt1, Akt2, Akt3, phospho-Akt S473, phospho-Akt T308, and α-tubulin were assayed by Western blotting of 104-S cell lines overexpressing c-Myc or Akt1 prior to CAPE treatment. (C) RWPE-1 cells were treated with increasing concentrations of CAPE for 96 h to determine suppressive effect of CAPE on normal prostate epithelial cells. (D) Protein expression of total Akt, phospho-Akt S473, phospho-Akt T308, phospho-GSK3β S9, and β-actin in RWPE-1 cells treated with 0, 3, and 10 μM CAPE for 96 h was assayed by Western blotting.

Similar articles

Cited by

References

    1. Sarker D, Reid AH, Yap TA, de Bono JS. Targeting the PI3K/AKT pathway for the treatment of prostate cancer. Clin Cancer Res. 2009;15:4799–805. - PubMed
    1. Kreisberg JI, Malik SN, Prihoda TJ, Bedolla RG, Troyer DA, Kreisberg S, et al. Phosphorylation of Akt (Ser473) is an excellent predictor of poor clinical outcome in prostate cancer. Cancer Res. 2004;64:5232–6. - PubMed
    1. Natarajan K, Singh S, Burke TR, Jr, Grunberger D, Aggarwal BB. Caffeic acid phenethyl ester is a potent and specific inhibitor of activation of nuclear transcription factor NF-kappa B. Proc Natl Acad Sci U S A. 1996;93:9090–5. - PMC - PubMed
    1. Bhimani RS, Troll W, Grunberger D, Frenkel K. Inhibition of oxidative stress in HeLa cells by chemopreventive agents. Cancer Res. 1993;53:4528–33. - PubMed
    1. Wang LC, Chu KH, Liang YC, Lin YL, Chiang BL. Caffeic acid phenethyl ester inhibits nuclear factor-kappaB and protein kinase B signalling pathways and induces caspase-3 expression in primary human CD4+ T cells. Clin Exp Immunol. 2010;160:223–32. - PMC - PubMed

Publication types

MeSH terms