. 2012 Dec;11(4):845-60.
doi: 10.1007/s12311-012-0383-5.

Friedreich's ataxia causes redistribution of iron, copper, and zinc in the dentate nucleus

Affiliations

Friedreich's ataxia causes redistribution of iron, copper, and zinc in the dentate nucleus

Arnulf H Koeppen et al. Cerebellum. 2012 Dec.

Abstract

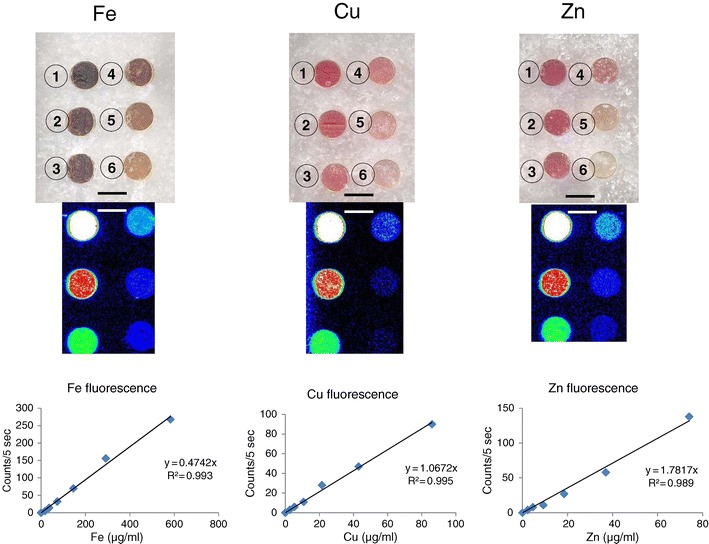
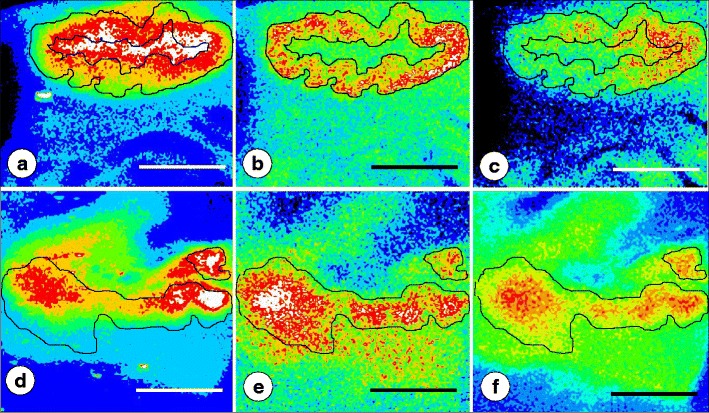
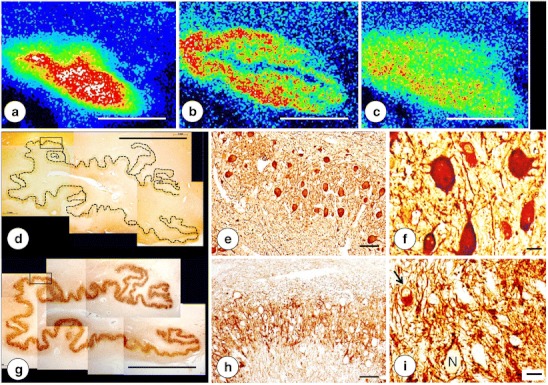
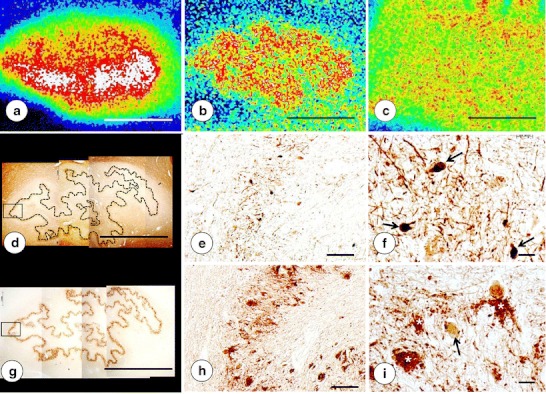
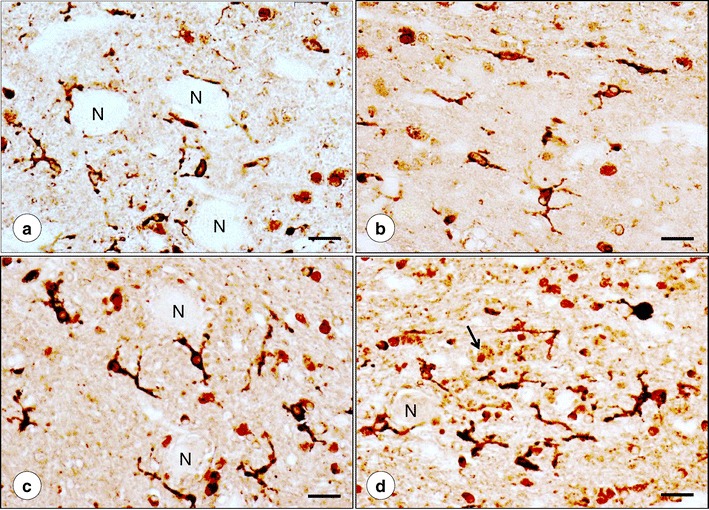
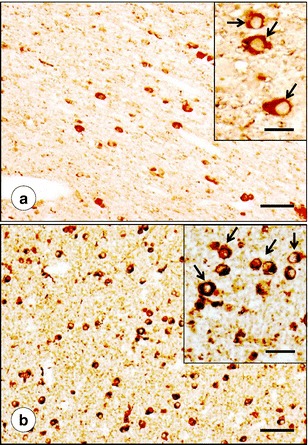
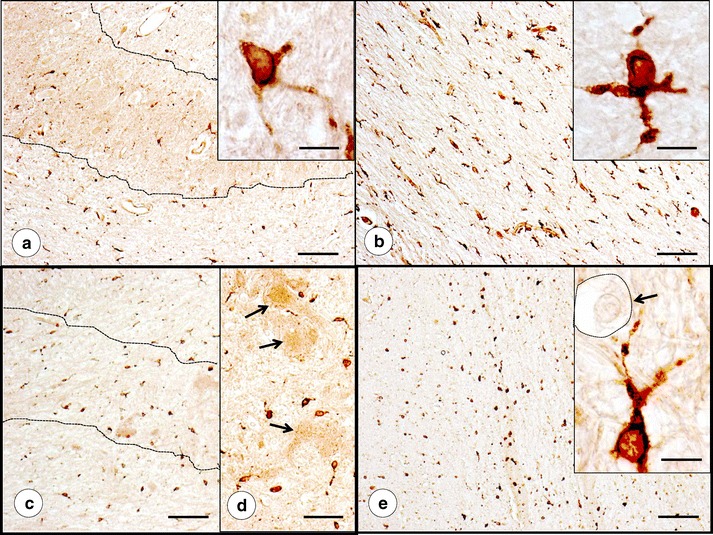
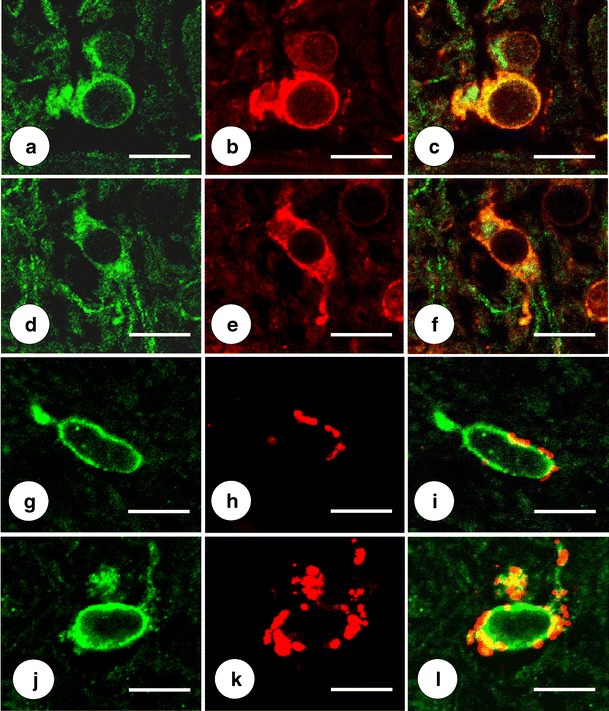
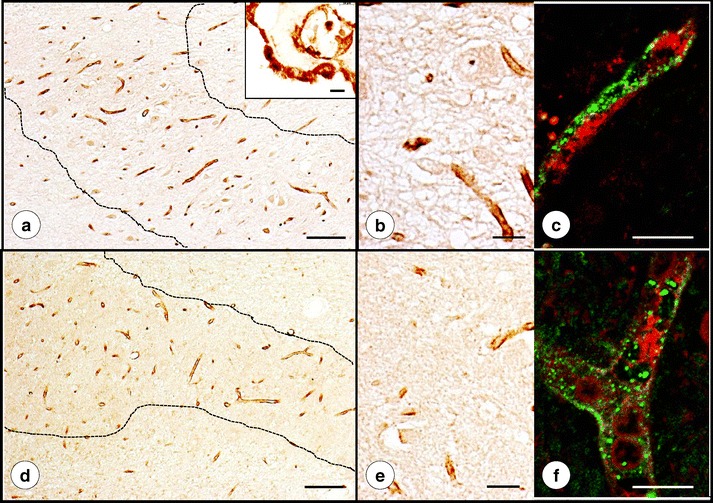
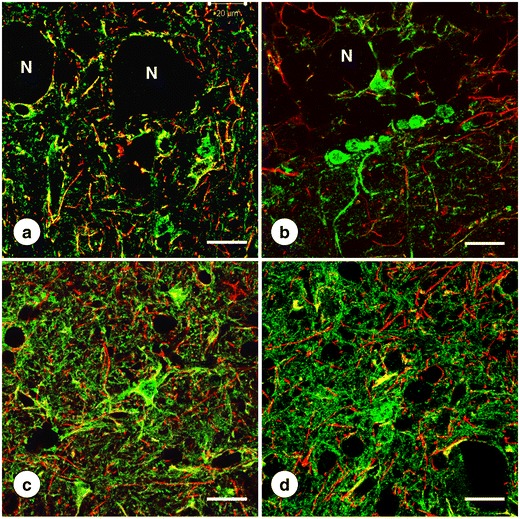
Friedreich's ataxia (FRDA) causes selective atrophy of the large neurons of the dentate nucleus (DN). High iron (Fe) concentration and failure to clear the metal from the affected brain tissue are potential risk factors in the progression of the lesion. The DN also contains relatively high amounts of copper (Cu) and zinc (Zn), but the importance of these metals in FRDA has not been established. This report describes nondestructive quantitative X-ray fluorescence (XRF) and "mapping" of Fe, Cu, and Zn in polyethylene glycol-dimethylsulfoxide (PEG/DMSO)-embedded DN of 10 FRDA patients and 13 controls. Fe fluorescence arose predominantly from the hilar white matter, whereas Cu and Zn were present at peak levels in DN gray matter. Despite collapse of the DN in FRDA, the location of the peak Fe signal did not change. In contrast, the Cu and Zn regions broadened and overlapped extensively with the Fe-rich region. Maximal metal concentrations did not differ from normal (in micrograms per milliliter of solid PEG/DMSO as means ± S.D.): Fe normal, 364 ± 117, FRDA, 344 ± 159; Cu normal, 33 ± 13, FRDA, 33 ± 18; and Zn normal, 32 ± 16, FRDA, 33 ± 19. Tissues were recovered from PEG/DMSO and transferred into paraffin for matching with immunohistochemistry of neuron-specific enolase (NSE), glutamic acid decarboxylase (GAD), and ferritin. NSE and GAD reaction products confirmed neuronal atrophy and grumose degeneration that coincided with abnormally diffuse Cu and Zn zones. Ferritin immunohistochemistry matched Fe XRF maps, revealing the most abundant reaction product in oligodendroglia of the DN hilus. In FRDA, these cells were smaller and more numerous than normal. In the atrophic DN gray matter of FRDA, anti-ferritin labeled mostly hypertrophic microglia. Immunohistochemistry and immunofluorescence of the Cu-responsive proteins Cu,Zn-superoxide dismutase and Cu(++)-transporting ATPase α-peptide did not detect specific responses to Cu redistribution in FRDA. In contrast, metallothionein (MT)-positive processes were more abundant than normal and contributed to the gliosis of the DN. The isoforms of MT, MT-1/2, and brain-specific MT-3 displayed only limited co-localization with glial fibrillary acidic protein. The results suggest that MT can provide effective protection against endogenous Cu and Zn toxicity in FRDA, similar to the neuroprotective sequestration of Fe in holoferritin.


Figures

Fig. 1
Fig. 1
Fe, Cu, and Zn standards. Top panel: Congealed solutions of Fe-III-, Cu-II-, and Zn-II-mesoporphyrins in gelatin capsules. The highest concentrations are present in ① of each standard. After dilution, the concentrations range, in micrograms per milliliter, from 620 to 19.375 for Fe; 86 to 2.688 for Cu; and 74 to 3.125 for Zn. Middle panel: Matching XRF maps of the standards shown in the top panel. Pseudocolors indicate the declining concentration from maximum (white) to red, green, light blue, and dark blue. Bottom panel: Regression analysis of Fe, Cu, and Zn. Ten point-measurements were made of each standard concentration and averaged. The mean values were reduced by background XRF that was obtained by sampling the block outside the capsules. The goodness of fit is given by R 2 values. Bars in top and middle panels represent 5 mm
Fig. 2
Fig. 2
XRF maps of the DN in a normal control and a case of FRDA. ac normal; df FRDA. The outlines of the Cu maps with peak signals (b, e) were transferred to the matching Fe and Zn maps. In the normal control (ac), zones of maximum Cu and Zn are clearly demarcated from the peak Fe map (white). In FRDA (case FRDA5 F in Table 1), the normal ribbon-like Cu map has been replaced by several coalescing fields (e) that show extensive overlap with the peak Fe map (d). The distribution of Zn remains similar to that of Cu. Bars, 5 mm
Fig. 3
Fig. 3
Fe, Cu, and Zn XRF maps of a normal DN and matching sections after recovery from PEG/DMSO. a Fe XRF; b Cu XRF; c Zn XRF. df Immunohistochemistry of NSE; gi Immunohistochemistry of GAD. For clarity, the low-power composite of the DN gray matter ribbon in d was outlined by an interrupted line. The microphotographs in e and h correspond to the regions indicated by the rectangles in d and g, respectively. The XRF maps confirm the differential localization of Fe, Cu, and Zn. The DN gray matter ribbon, as shown by NSE (d) and GAD reaction products (g), matches the distribution of maximum Cu (b) and Zn (c), whereas Fe XRF places the bulk of Fe into the central white matter of the DN (a). Both immunohistochemical stains show the normal thickness of DN gray matter (250–300 μm). NSE reaction product visualizes large and small neurons of the normal DN (ef). GAD reaction product labels axosomatic and axodendritic terminals, yielding negative images of DN nerve cells (hi). The arrow in i points to a small neuron with GAD immunoreactivity in its cytoplasm. N, negative image of a neuron. Bars, ad and g 5 mm; e, h 100 μm; f, i 20 μm
Fig. 4
Fig. 4
Fe, Cu, and Zn XRF maps of a DN in FRDA and matching sections after recovery from PEG/DMSO. a Fe XRF; b Cu XRF; c Zn XRF. df Immunohistochemistry of NSE; gi Immunohistochemistry of GAD. For clarity, the low-power composite of the DN gray matter ribbon in d was outlined by an interrupted line. The microphotographs in e and h correspond to the regions indicated by the rectangles in d and g, respectively. Regions of maximal XRF for Fe (a), Cu (b), and Zn (c) show extensive overlap. Higher magnification confirms thinning of the DN to 100–120 μm and loss of large neurons (e, h). Small neurons are present in normal abundance (arrows in f). Atrophy of the DN gray matter is also evident following GAD immunohistochemistry (gi). Negative images of large neurons are absent, but grumose degeneration retains GAD immunoreactivity (white asterisks in i). The arrow in i indicates a small intact GABA-ergic neuron with cytoplasmic GAD reaction product. Images derived from patient FRDA3, F in Table 1. Bars: ad, g 5 mm; e, h 100 μm; f, i 20 μm
Fig. 5
Fig. 5
Ferritin immunohistochemistry of DN gray matter. a, b Normal control; c, d FRDA (case FRDA1, M in Table 1). In the normal DN gray matter, reaction product labels cells with the morphology of microglia (a, b) though the juxtaneuronal ferritin-positive cells in a may represent oligodendroglia [4]. At the junction to the hilar white matter (b), ferritin-positive cells are all microglia. In FRDA, ferritin-reactive microglia are larger (c) and more frequent about grumose degeneration (d). The arrow in d points toward grumose degeneration that also contains ferritin reaction product. The parent neuron of the dendrites surrounded by grumose degeneration is located to the left. N, negative images of neuronal cell bodies; bars, 20 μm
Fig. 6
Fig. 6
Ferritin immunohistochemistry of hilar white matter of the DN. a Normal control; b FRDA (case FRDA1, M in Table 1). In the normal hilar white matter, ferritin-positive cells are consistent with oligodendroglia (arrows in a, inset). Ferritin reaction product also labels oligodendroglia in the DN white matter of FRDA (b), but their density per unit area is higher, and their size is smaller (arrows in b, inset). Bars: a, b 50 μm; (a and b insets), 20 μm
Fig. 7
Fig. 7
SOD immunohistochemistry of DN gray and white matter. a, b, Normal control; ce, FRDA (case FRDA8, M in Table 1); a, cd Gray matter (DN outlined by interrupted lines); b, e White matter. The plump SOD-reactive cells with sparse processes are consistent with microglia (insets in a, b, and e). These SOD-reactive cells are generally more frequent in the hilar white matter of the DN (b, e) than in the DN gray matter (a, c). Abundance, size, and shape of SOD-reactive cells in FRDA (ce) do not differ from normal (a, b). SOD-reactive cells cluster around grumose degeneration in FRDA (arrows in d). The inset in e (arrow and interrupted line) shows a large SOD-negative oligodendrocyte in the immediate vicinity of a strongly SOD-reactive microglial cell. Bars: ac and e 100 μm; insets in a, b, and e 10 μm (oil immersion optics); d 50 μm
Fig. 8
Fig. 8
Double-label immunofluorescence of the pairs SOD/ferritin and SOD/CD68 in the DN of normal controls and two cases of FRDA. ac, gi Normal controls; df FRDA (case FRDA8, M in Table 1); jl FRDA (case FRDA2, M in Table 1); a, d SOD (FITC, green); b, e Ferritin (Cy3, red); c, f Merged images. g, j SOD (Alexa488); h, k CD68 (Cy3); i, l merged images. SOD fluorescence in perikarya and proximal processes co-localizes with cytosolic ferritin (c, f). The SOD-immunoreactive cells also contain granular CD68 reaction product (i, l). In FRDA (kl), CD68 reaction product is more abundant, suggesting microglial hypertrophy (see also Fig. 5c). Confocal microscopy at an optical slice thickness of 1 μm. Bars, 10 μm
Fig. 9
Fig. 9
ATP7A immunohistochemistry and immunofluorescence of the DN in a normal control and FRDA. ac Normal control; df FRDA (case FRDA2, M in Table 1). In a and d, the approximate boundaries of the DN gray matter are outlined by interrupted lines. Positive-contrast reaction product labels capillary walls that are much more abundant in the DN neuropil than in the white matter of hilus or fleece, reflecting the generally higher vascularity of gray matter. FRDA (df) does not differ from the control (ac). The inset in a shows reaction product in epithelial cells of the choroid plexus on the same slide, serving as an internal positive control. Higher power resolution (b and e) shows the granular nature of ATP7A reaction product in vessel walls, which is more apparent on double-label fluorescence of ATP7A (FITC, green) and RCA-1 (TRITC, red) (c and f). Fluorescent reaction product of ATP7A is present in granules or vesicles with a diameter of less than 0.5 μm and does not occur uniformly in all areas of the vessel wall. Confocal microscopy at an optical slice thickness of 1 μm. Bars: a, d 100 μm; b, e, and inset in a 20 μm; c, f 10 μm
Fig. 10
Fig. 10
Double-label immunofluorescence of MT-1/2, MT-3, and GFAP in the DN. a, b Normal control; c, d FRDA (FRDA8, M in Table 1); a, c MT-1/2; b, d MT-3. The MTs are shown by green fluorescence, GFAP by red fluorescence. Neuronal loss in FRDA (c) and (d) is apparent by the absence of nerve cell voids (N). MT-1/2 and MT-3-containing astrocytic cell bodies show no GFAP reaction product. Only a few glial processes display co-localization of MT-1/2 and GFAP (a, c) or MT-3 and GFAP (b, d). In FRDA, both MT-1/2 and MT-3 show a greater abundance of finely granular green reaction product. Confocal microscopy at an optical slice thickness of 1 μm. Bars, 20 μm

Similar articles

Cited by

References

    1. Koeppen AH. Friedreich's ataxia: pathology, pathogenesis, and molecular genetics. J Neurol Sci. 2011;303:1–12. doi: 10.1016/j.jns.2011.01.010. - DOI - PMC - PubMed
    1. Koeppen AH, Davis AN, Morral JA. The cerebellar component of Friedreich's ataxia. Acta Neuropathol. 2011;122:323–30. doi: 10.1007/s00401-011-0844-9. - DOI - PMC - PubMed
    1. Koeppen AH, Dickson AC, Lamarche JB, Robitaille Y. Synapses in the hereditary ataxias. J Neuropathol Exp Neurol. 1999;58:748–64. doi: 10.1097/00005072-199907000-00009. - DOI - PubMed
    1. Koeppen AH, Michael SC, Knutson MD, Haile DJ, Qian J, Levi S, et al. The dentate nucleus in Friedreich's ataxia: the role of iron responsive proteins. Acta Neuropathol. 2007;114:163–73. doi: 10.1007/s00401-007-0220-y. - DOI - PubMed
    1. Bayot A, Santos R, Camadro J-M, Rustin P. Friedreich ataxia: the vicious circle hypothesis revisited. BMC Med. 2011. doi:10.1186/1741-7015-9-112. - PMC - PubMed

Publication types